How to draw four graphs and share an X-axis, and other related issues?

TeeChart for Microsoft Visual Studio .NET, Xamarin Studio (Android, iOS & Forms) & Monodevelop.
Post Reply
coldwind
Newbie
Newbie
Posts: 41
Joined: Tue Dec 27, 2022 12:00 am

How to draw four graphs and share an X-axis, and other related issues?

Post by coldwind » Thu Aug 31, 2023 5:38 am

Question1:How do I find the maximum distance to the left of four graphs and set this maximum distance for all graphs. Or is there a better way to do this, so that if y is not aligned, the points on the top and bottom graph are not aligned
four chart.png
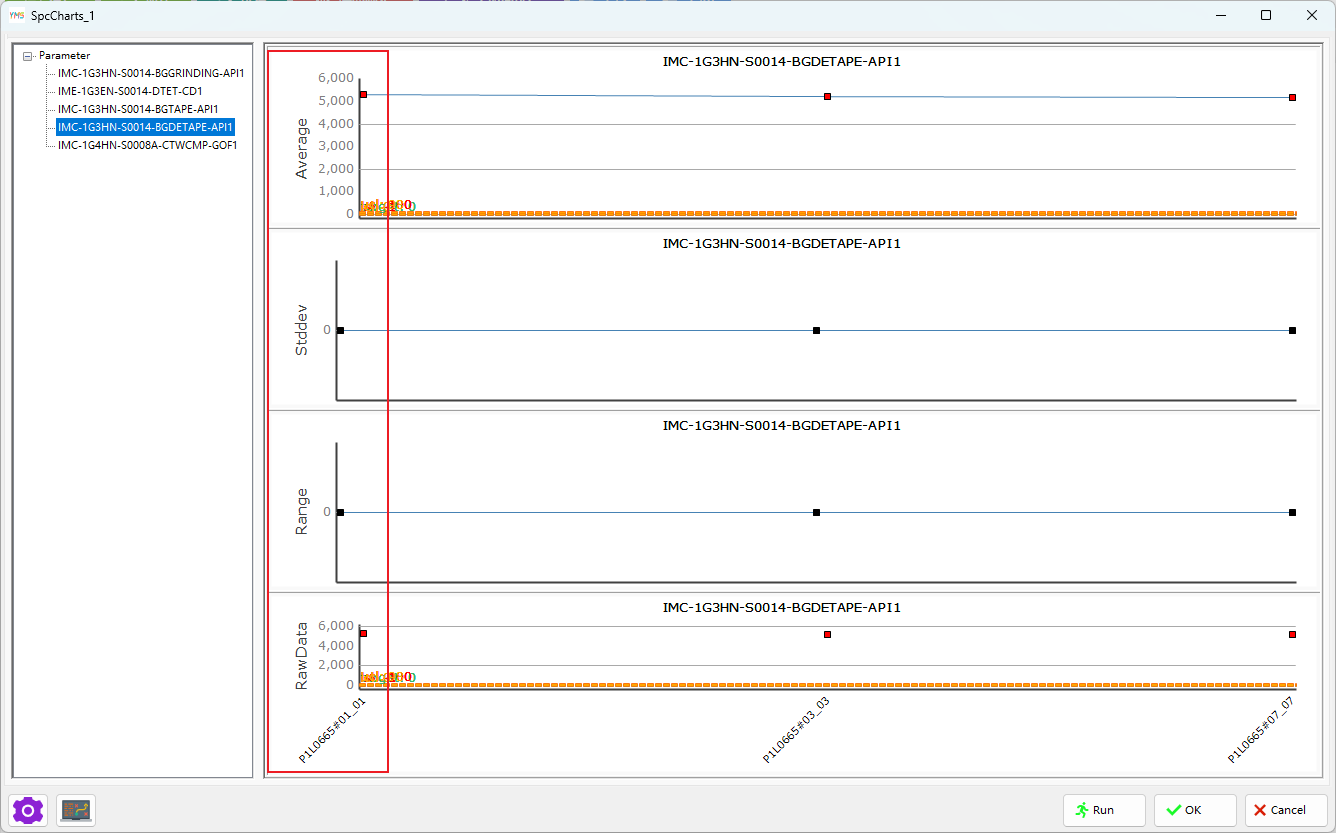
four chart.png (39.54 KiB) Viewed 31639 times

Question2:The X-axis label in the last figure is too long. I hope it can be displayed as a line wrap if it is too long, and the spacing between X-axis points and points can be widened
Line feed example.png
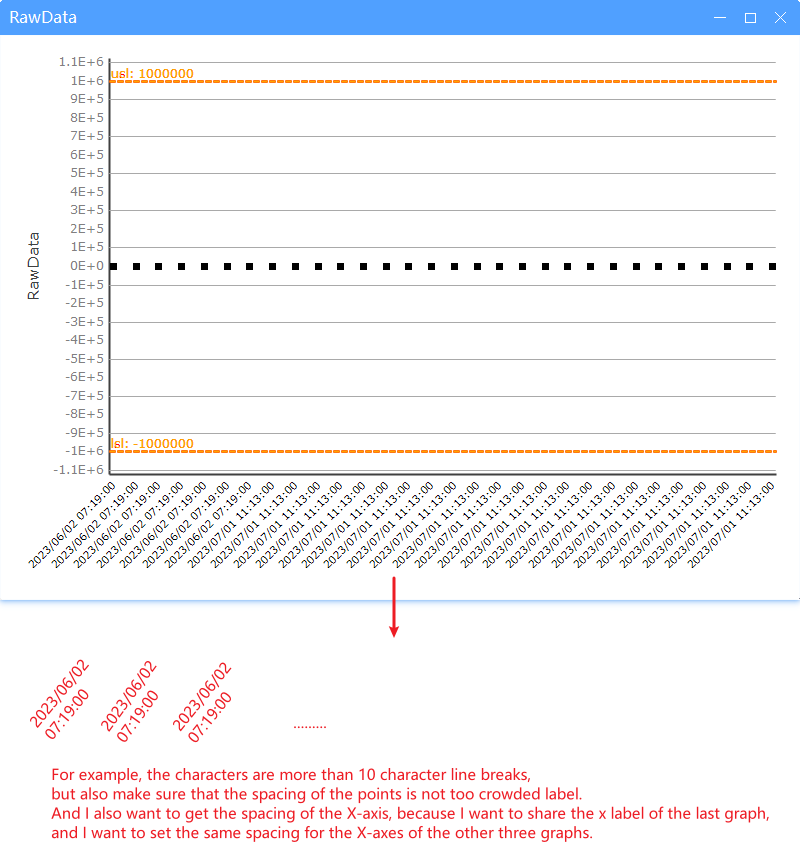
Line feed example.png (62.38 KiB) Viewed 31639 times
Question3:The X-axis names of the first five points in the red box are the same, I hope that each point can correspond to its own X-axis label, and then each point should have vertical lines, such as the gray line I hand-painted in the red box (it should be tchart.Axes.Bottom.Grid), I expect that each point has a corresponding X-axis. And they all have Axes.Bottom.Grid
Grid.png
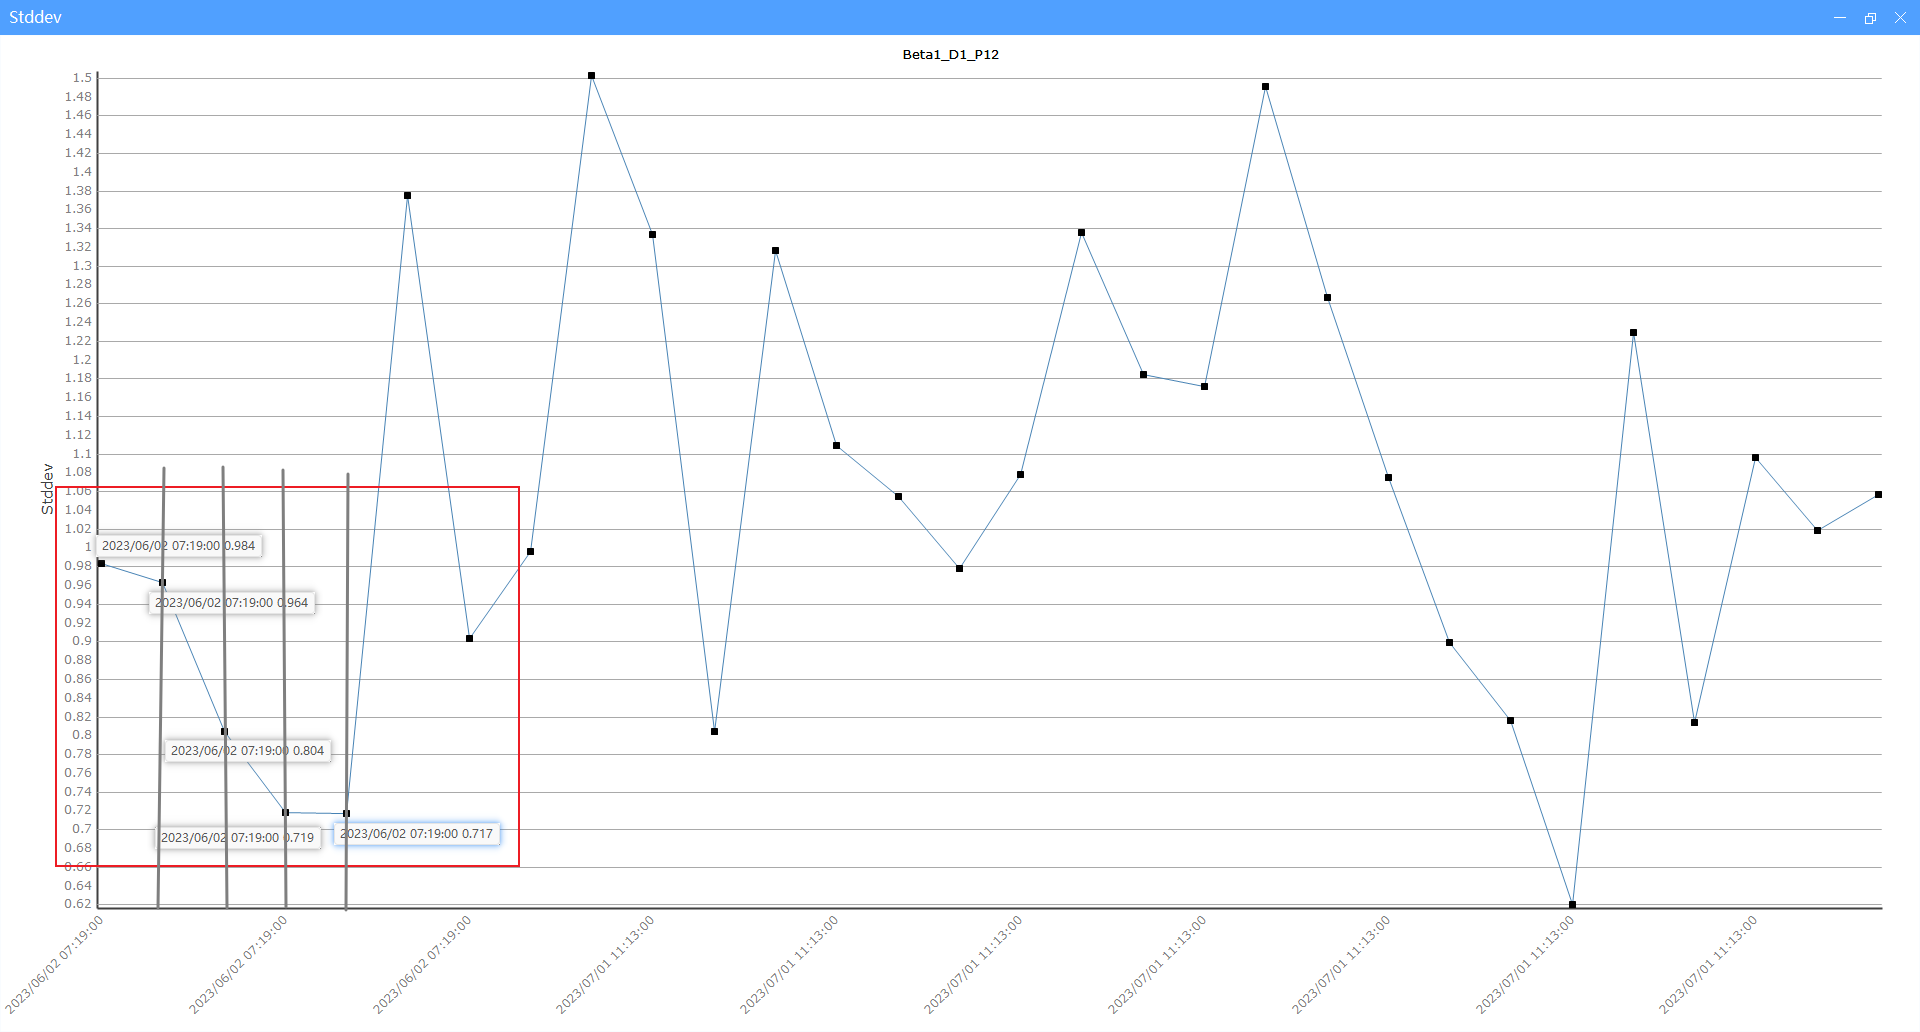
Grid.png (98.24 KiB) Viewed 31639 times
Hope to reply as soon as possible, thank you !

Christopher
Guru
Posts: 1603
Joined: Fri Nov 15, 2002 12:00 am

Re: How to draw four graphs and share an X-axis, and other related issues?

Post by Christopher » Thu Aug 31, 2023 7:58 am

Hello,
coldwind wrote:
Thu Aug 31, 2023 5:38 am
Question1:How do I find the maximum distance to the left of four graphs and set this maximum distance for all graphs. Or is there a better way to do this, so that if y is not aligned, the points on the top and bottom graph are not aligned
A similar question is answered here.
coldwind wrote:
Thu Aug 31, 2023 5:38 am
Question2:The X-axis label in the last figure is too long. I hope it can be displayed as a line wrap if it is too long, and the spacing between X-axis points and points can be widened
Did you try Marc's suggestion here?
coldwind wrote:
Thu Aug 31, 2023 5:38 am
Question3:The X-axis names of the first five points in the red box are the same, I hope that each point can correspond to its own X-axis label, and then each point should have vertical lines, such as the gray line I hand-painted in the red box (it should be tchart.Axes.Bottom.Grid), I expect that each point has a corresponding X-axis. And they all have Axes.Bottom.Grid
You can try using custom axes; a similar question was asked here.
Best Regards,
Christopher Ireland / Development & Support
Steema Software
Avinguda Montilivi 33, 17003 Girona, Catalonia
Tel: 34 972 218 797
http://www.steema.com
Instructions - How to post in this forum

coldwind
Newbie
Newbie
Posts: 41
Joined: Tue Dec 27, 2022 12:00 am

Re: How to draw four graphs and share an X-axis, and other related issues?

Post by coldwind » Thu Aug 31, 2023 12:33 pm

I want the label to wrap after 15 characters, but because the label is so long, it may need to wrap more than once. Therefore, it is also hoped that the spacing between points will increase synchronously according to the current number of newlines. The label spacing on the top of the hand-drawn sketch is smaller, and the label spacing on the bottom is larger. I wonder if it can be achieved?
Freehand drawing.png
Freehand drawing.png (197.82 KiB) Viewed 31613 times

Christopher
Guru
Posts: 1603
Joined: Fri Nov 15, 2002 12:00 am

Re: How to draw four graphs and share an X-axis, and other related issues?

Post by Christopher » Fri Sep 01, 2023 10:11 am

Hello,
coldwind wrote:
Thu Aug 31, 2023 12:33 pm
I want the label to wrap after 15 characters, but because the label is so long, it may need to wrap more than once.
Before adding the labels to the Chart, I think it would be easy to parse the label string and add in a '\n' character every 15 characters. TeeChart will recognize these line breaks and will adjust the spacing accordingly.
Best Regards,
Christopher Ireland / Development & Support
Steema Software
Avinguda Montilivi 33, 17003 Girona, Catalonia
Tel: 34 972 218 797
http://www.steema.com
Instructions - How to post in this forum

coldwind
Newbie
Newbie
Posts: 41
Joined: Tue Dec 27, 2022 12:00 am

Re: How to draw four graphs and share an X-axis, and other related issues?

Post by coldwind » Sat Sep 02, 2023 6:07 am

According to your suggestion, I have wrapped the X-axis label before adding the icon, but the label did not automatically separate and overlapped, as shown in the figure below
label overlap.png
label overlap.png (36.96 KiB) Viewed 31552 times
The present situation is still not like the hand-drawn picture. When the width of the label newline becomes larger, the spacing between points does not automatically open. Is there any solution?

coldwind
Newbie
Newbie
Posts: 41
Joined: Tue Dec 27, 2022 12:00 am

Re: How to draw four graphs and share an X-axis, and other related issues?

Post by coldwind » Sat Sep 02, 2023 7:22 am

Christopher wrote:
Thu Aug 31, 2023 7:58 am
Hello,
coldwind wrote:
Thu Aug 31, 2023 5:38 am
Question1:How do I find the maximum distance to the left of four graphs and set this maximum distance for all graphs. Or is there a better way to do this, so that if y is not aligned, the points on the top and bottom graph are not aligned
A similar question is answered here.
coldwind wrote:
Thu Aug 31, 2023 5:38 am
Question2:The X-axis label in the last figure is too long. I hope it can be displayed as a line wrap if it is too long, and the spacing between X-axis points and points can be widened
Did you try Marc's suggestion here?
coldwind wrote:
Thu Aug 31, 2023 5:38 am
Question3:The X-axis names of the first five points in the red box are the same, I hope that each point can correspond to its own X-axis label, and then each point should have vertical lines, such as the gray line I hand-painted in the red box (it should be tchart.Axes.Bottom.Grid), I expect that each point has a corresponding X-axis. And they all have Axes.Bottom.Grid
You can try using custom axes; a similar question was asked here.
Question1:According to the example you gave, the following code is used. It is true that the four images can be aligned with the Y axis, but it does not seem to be set according to the maximum distance between the left and left borders of the maximum y axis.The Y-axis label is weighed down by the Y-axis title!

Code: Select all

 List<int> yLabelLen = new List<int>
 {
     avgChart.Axes.Left.MaxLabelsWidth(),
     stddevChart.Axes.Left.MaxLabelsWidth(),
     rangeChart.Axes.Left.MaxLabelsWidth(),
     rawDataChart.Axes.Left.MaxLabelsWidth()
 };
 int yLabelLenMax = yLabelLen.Max();
 avgChart.Axes.Left.Labels.CustomSize = yLabelLenMax;
 stddevChart.Axes.Left.Labels.CustomSize = yLabelLenMax;
 rangeChart.Axes.Left.Labels.CustomSize = yLabelLenMax;
 rawDataChart.Axes.Left.Labels.CustomSize = yLabelLenMax;
avgChart、stddevChart、rangeChart and rawDataChart is four Tcharts.
The Axes.Left.MaxLabelsWidth() value for all four figures is 15,This is clearly not true!

The Y-axis label is weighed down by the Y-axis title!
The Y-axis label is weighed down by the Y-axis title!.png
The Y-axis label is weighed down by the Y-axis title!.png (38.6 KiB) Viewed 31549 times
AnotherQuestion: x label try to attach the bottom border, which property can set this spacing?
x label .png
x label .png (38.14 KiB) Viewed 31549 times

Christopher
Guru
Posts: 1603
Joined: Fri Nov 15, 2002 12:00 am

Re: How to draw four graphs and share an X-axis, and other related issues?

Post by Christopher » Tue Sep 05, 2023 7:50 am

Hello,
coldwind wrote:
Sat Sep 02, 2023 7:22 am
Question1:According to the example you gave, the following code is used. It is true that the four images can be aligned with the Y axis, but it does not seem to be set according to the maximum distance between the left and left borders of the maximum y axis.The Y-axis label is weighed down by the Y-axis title!
I'm not sure quite what the question is here, but a couple of things:
  • do you have FixedLabelSize set to false? e.g.

    Code: Select all

    tChart1.Axes.Left.FixedLabelSize = false;
    
  • you might consider using the GetAxesChartRect event for finer control over the size of the rectangle defined by the four axes. A simple example of it's use is here.
coldwind wrote:
Sat Sep 02, 2023 7:22 am
AnotherQuestion: x label try to attach the bottom border, which property can set this spacing?
This is the job of the Increment property, e.g.

Code: Select all

            tChart1.Series.Add(typeof(Line)).FillSampleValues();
            tChart1[0].XValues.DateTime = true;

            tChart1.Axes.Bottom.Labels.Angle = 90;
            tChart1.Axes.Bottom.Increment = Utils.GetDateTimeStep(DateTimeSteps.OneWeek);
Best Regards,
Christopher Ireland / Development & Support
Steema Software
Avinguda Montilivi 33, 17003 Girona, Catalonia
Tel: 34 972 218 797
http://www.steema.com
Instructions - How to post in this forum

coldwind
Newbie
Newbie
Posts: 41
Joined: Tue Dec 27, 2022 12:00 am

Re: How to draw four graphs and share an X-axis, and other related issues?

Post by coldwind » Wed Sep 06, 2023 9:24 am

Code: Select all

 List<int> yLabelLen = new List<int>
 {
     avgChart.Axes.Left.MaxLabelsWidth(),
     stddevChart.Axes.Left.MaxLabelsWidth(),
     rangeChart.Axes.Left.MaxLabelsWidth(),
     rawDataChart.Axes.Left.MaxLabelsWidth()
 };
 int yLabelLenMax = yLabelLen.Max();
 avgChart.Axes.Left.Labels.CustomSize = yLabelLenMax;
 stddevChart.Axes.Left.Labels.CustomSize = yLabelLenMax;
 rangeChart.Axes.Left.Labels.CustomSize = yLabelLenMax;
 rawDataChart.Axes.Left.Labels.CustomSize = yLabelLenMax;
avgChart、stddevChart、rangeChart and rawDataChart is four Tcharts.
The Axes.Left.MaxLabelsWidth() value for all four figures is 15,This is clearly not true!

How do I get the width of the Y-axis from the leftmost part of the current graph?As shown below
distance.png
distance.png (39.44 KiB) Viewed 30568 times

Christopher
Guru
Posts: 1603
Joined: Fri Nov 15, 2002 12:00 am

Re: How to draw four graphs and share an X-axis, and other related issues?

Post by Christopher » Thu Sep 07, 2023 9:01 am

Hello,
coldwind wrote:
Wed Sep 06, 2023 9:24 am
How do I get the width of the Y-axis from the leftmost part of the current graph?As shown below
There are a couple of ways to do this, e.g.

Code: Select all

        private void InitializeChart()
        {
            tChart1.Series.Add(typeof(Line)).FillSampleValues();

            tChart1.Axes.Left.AxisPen.Visible = true;
            tChart1.Axes.Left.AxisPen.Width = 3;
            tChart1.Axes.Left.AxisPen.Color = Color.Red;

            tChart1.GetAxesChartRect += TChart1_GetAxesChartRect;
            tChart1.BeforeDrawAxes += TChart1_BeforeDrawAxes;
        }

        private void TChart1_BeforeDrawAxes(object sender, Steema.TeeChart.Drawing.IGraphics3D g)
        {
            MessageBox.Show($"IStartPos: {tChart1.Axes.Bottom.IStartPos}");

            g.Pen.Width = 3;
            g.Pen.Color = Color.Blue;
            g.Line(new Point(0, g.ChartYCenter), new Point(tChart1.Axes.Bottom.IStartPos, g.ChartYCenter));
        }

        private void TChart1_GetAxesChartRect(object sender, Steema.TeeChart.GetAxesChartRectEventArgs e)
        {
            MessageBox.Show($"GetAxesChartRect: {e.AxesChartRect.Left}");
        }
We use 'tChart1.Axes.Bottom.IStartPos' because the Bottom axis is horizontal, therefore the IStartPos is a horizontal (X) value.
Best Regards,
Christopher Ireland / Development & Support
Steema Software
Avinguda Montilivi 33, 17003 Girona, Catalonia
Tel: 34 972 218 797
http://www.steema.com
Instructions - How to post in this forum

Post Reply