Page 1 of 1
Plot Bubble Cloud Chart (in Gallery) using TeeChart .NET
Posted: Thu Apr 06, 2023 6:32 am
by 20091735
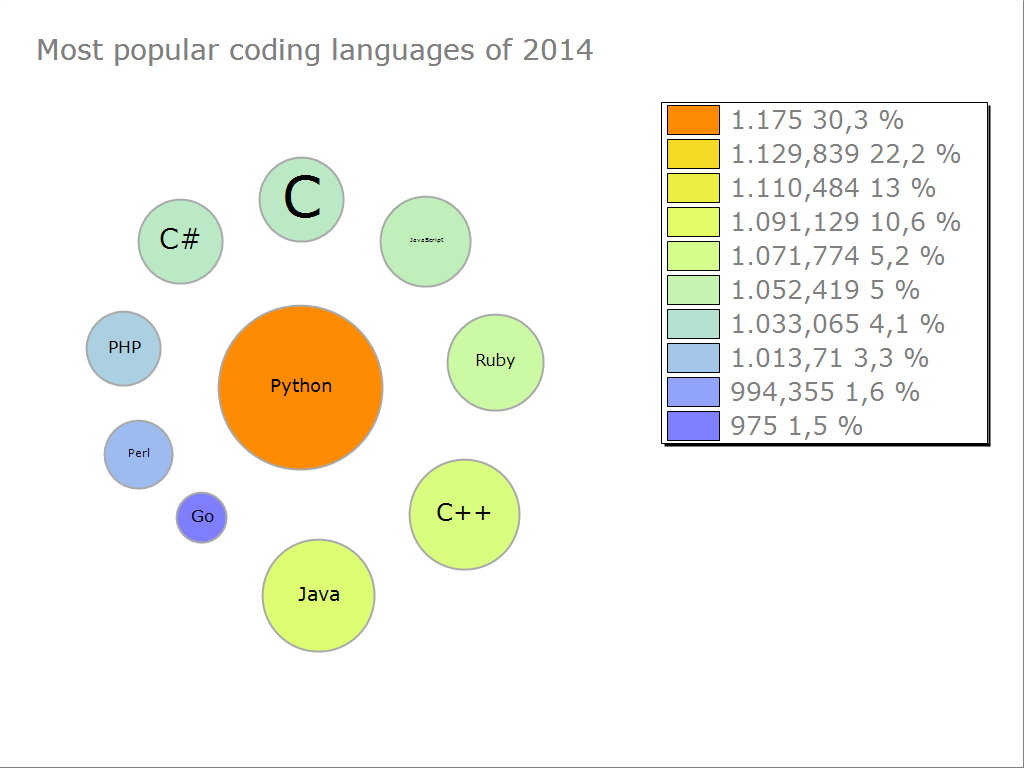
Can I know how to plot the Bubble Cloud Chart in SteemaGallery using TeeChart .NET and C#? Can I have the codes for this chart?
You may find the chart in these links
https://www.steema.com/linkIn/chart_gallery and
https://www.steema.com/uploads/products/ProgLangs.png.
Attached the chart.
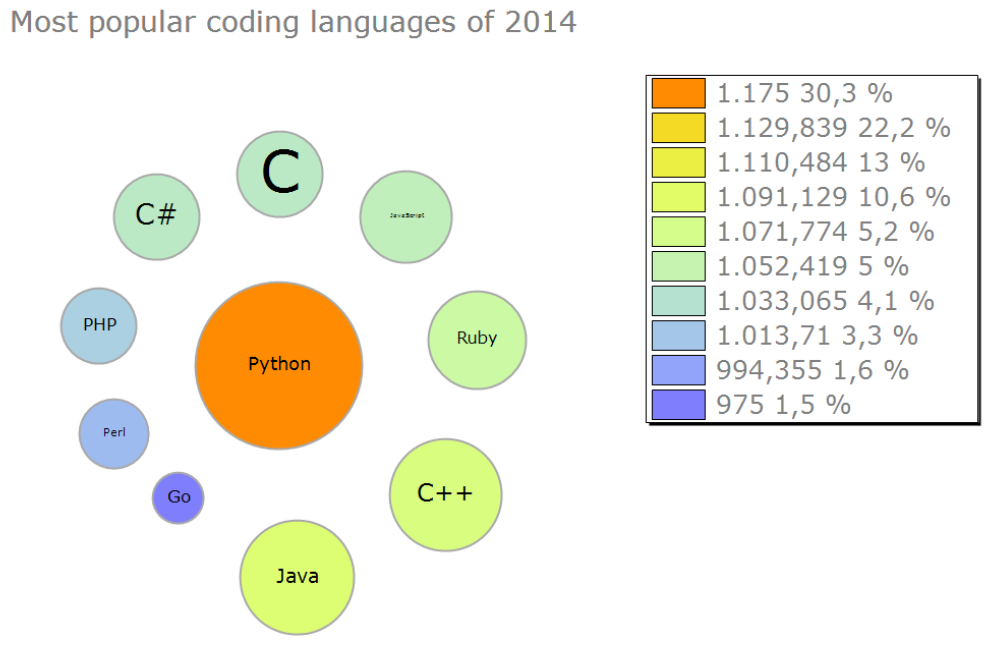
- Steema Gallery - Bubble Cloud.png (125.15 KiB) Viewed 2375 times
Thanks.
Re: Plot Bubble Cloud Chart (in Gallery) using TeeChart .NET
Posted: Thu Apr 06, 2023 10:21 am
by Christopher
Hello,
although not exactly that image, there's a bubble cloud example in our GitHub examples
here. Running that example and navigating the menu on the left gives me:
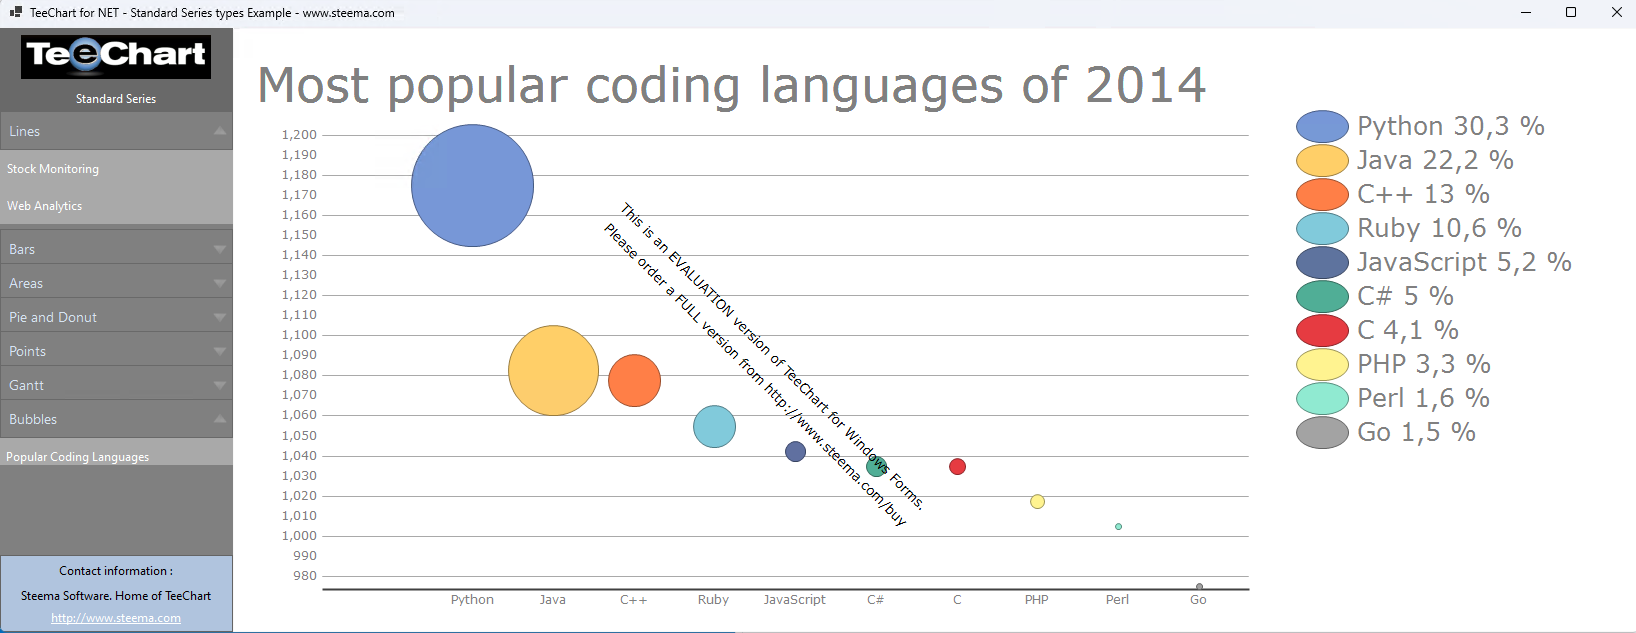
- Screenshot from 2023-04-06 12-15-26.png (118.75 KiB) Viewed 2369 times
Although this example is for the Business version of TeeChart, it will also work for the Pro version.
Re: Plot Bubble Cloud Chart (in Gallery) using TeeChart .NET
Posted: Fri Apr 07, 2023 1:30 am
by 20091735
Hello,
I am actually looking for chart which plots based on the points size, without axes hence the random position for points. Can I have the sample code of a chart where it only plots the points (bubbles) according to the size?
For example, the data is
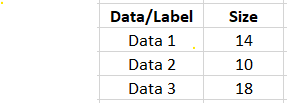
- Data.png (2.72 KiB) Viewed 2355 times
and the chart will be
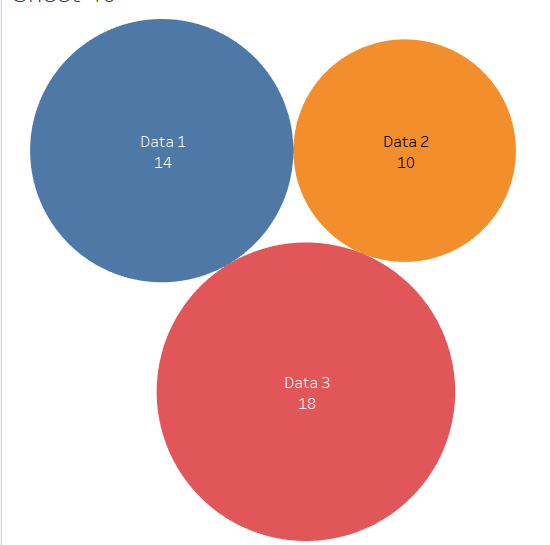
- Chart.png (13.73 KiB) Viewed 2355 times
The position of the points (bubbles) are random and placed automatically without overlapping each other. No x axis and y axis values. The Data/Label column will be used to label and distinguish the bubbles whereas the size of the bubbles are determined by the size column.
Thanks.
Re: Plot Bubble Cloud Chart (in Gallery) using TeeChart .NET
Posted: Tue Apr 11, 2023 8:05 am
by Christopher
Hello,
I can use the following code:
Code: Select all
        public Form1()
        {
            InitializeComponent();
            InitializeChart();
        }

        private void InitializeChart()
        {
            tChart1.Legend.Visible = false;
            tChart1.Header.Visible = false;

            var bcloud = new BubbleCloud(tChart1.Chart)
            {
                UseColorRange = false,
                UsePalette = true,
                PaletteStyle = PaletteStyles.Strong
            };
            bcloud.Add(14, "Data 1");
            bcloud.Add(10, "Data 2");
            bcloud.Add(18, "Data 3");
            bcloud.Separation = 3;
            bcloud.SizeRatio = 4;
            bcloud.Rotation = 180;
        }
To produce this Chart:
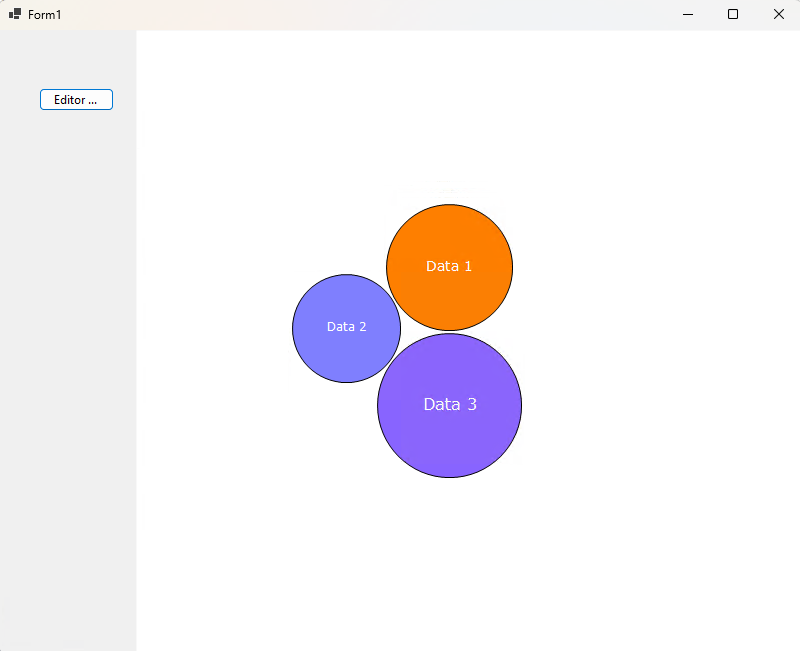
- Screenshot from 2023-04-11 12-09-29.png (34.47 KiB) Viewed 2318 times
Is this what you are looking for?