TeeChart for Microsoft Visual Studio .NET, Xamarin Studio (Android, iOS & Forms) & Monodevelop.
-
amol
- Advanced
- Posts: 231
- Joined: Tue Mar 29, 2005 5:00 am
Post
by amol » Sat Sep 17, 2016 11:34 am
Hi Steema Support,
We want to create Tornado plot For that we are using horizontal Bar. We are facing a issue that the bar is always starting from axis origin as shown in image below:
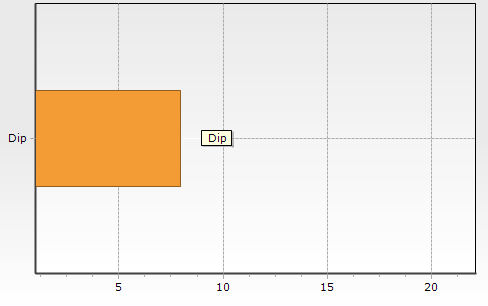
- img 1
- steem2.png (3.42 KiB) Viewed 10731 times
in this we have given value:
horizbar.Add(8,"Dip");
so it is drawing like the above img.
But we want something like the below image:
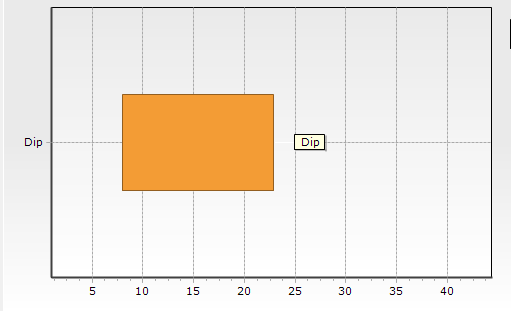
- img2
- img2.png (4.11 KiB) Viewed 10731 times
So here we want that our bar should draw between value 8 to 23 as shown in above image.
Means we do not want to draw bar from axis scale or from origin.
please provide any solution asap.
Thanks in advance.
Regards,
Planoresearch
-
Christopher
- Guru
- Posts: 1603
- Joined: Fri Nov 15, 2002 12:00 am
Post
by Christopher » Mon Sep 19, 2016 8:50 am
Hello,
You could try using a Gantt series, e.g.
Code: Select all
    Gantt series;
    private void InitializeChart()
    {
      tChart1.Aspect.View3D = false;
      series = new Gantt(tChart1.Chart);

      series.Add(8, 23, 0, "Dip", Color.Red);
      series.Pointer.VertSize = 40;
      series.XValues.DateTime = false;
      tChart1.Axes.Bottom.SetMinMax(0, 25);
    }
which gives this:
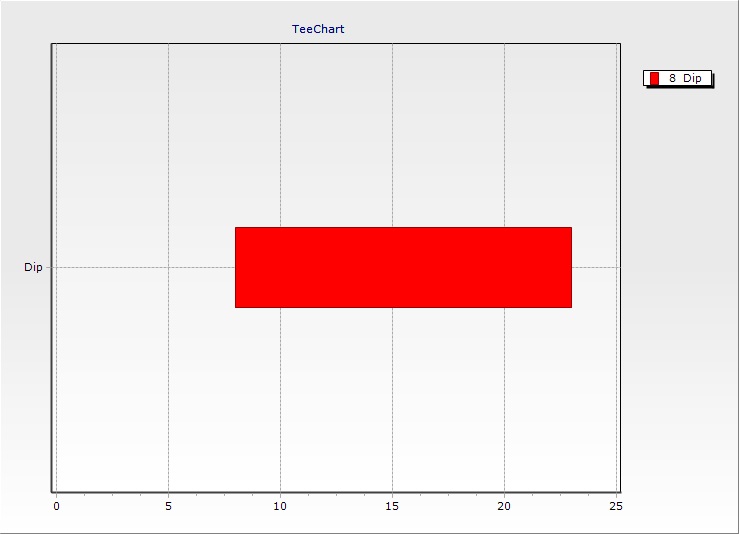
- 636098790206516110.jpg (35.9 KiB) Viewed 10719 times
-
amol
- Advanced
- Posts: 231
- Joined: Tue Mar 29, 2005 5:00 am
Post
by amol » Thu Sep 22, 2016 8:08 am
Hi Steema Support.
Thanks for the response. I am using the the way you have suggested but I am unable to show the Markstip on the Chart. How to show the Markstip as showing in the above image.
When we use Gantt.marks.visible =true;
then it shows markstip on the mid of the series but we want show it on both side (left side of the bar and right side of the bar not in the mid of the series). as shown in above image.
Please provide the solution as soon as possible. very urgent..
Thanks in advance.
Plano Research Corporation
-
Christopher
- Guru
- Posts: 1603
- Joined: Fri Nov 15, 2002 12:00 am
Post
by Christopher » Thu Sep 22, 2016 12:36 pm
Hello,
As you already know, it is possible to draw custom elements onto the chart. If you wish full control over the series marks, you could simply draw your own e.g.
Code: Select all
    Gantt series;
    private void InitializeChart()
    {
      tChart1.Aspect.View3D = false;
      series = new Gantt(tChart1.Chart);
      series.Add(8, 23, 0, "Dip", Color.Red);
      series.Pointer.VertSize = 40;
      series.XValues.DateTime = false;
      tChart1.Axes.Bottom.SetMinMax(0, 35);

      tChart1.AfterDraw += TChart1_AfterDraw;
    }

    private void TChart1_AfterDraw(object sender, Graphics3D g)
    {
      Action DrawMarks = () =>
      {
        for (int i = 0; i < series.Count; i++)
        {
          g.Font.Size = 16;
          string text = series.Labels[i];
          int buffer = 5;
          int height = (int)Math.Ceiling(g.TextHeight(text)) + buffer;
          int width = (int)Math.Ceiling(g.TextWidth(text)) + buffer;
          int xPos = series.CalcXPosValue(series.EndValues[i]) + width;
          int yPos = series.CalcYPos(i) - (height / 2);
          Rectangle rect = Utils.FromLTRB(xPos, yPos, xPos + width, yPos + height);
          g.Brush.Color = Color.Yellow;
          g.Rectangle(rect);
          g.TextOut(rect.X + (buffer / 2), rect.Y + (buffer / 2), text);
          g.Pen.Color = Color.White;
          g.Pen.Width = 3;
          g.HorizontalLine(xPos - width, xPos, yPos + (height / 2));
        }
      };

      DrawMarks();
    }
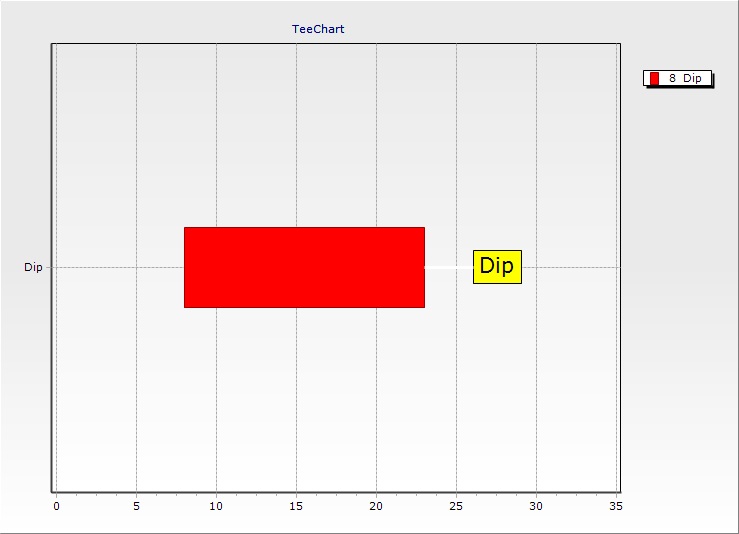
- 636101518132009907.jpg (40.79 KiB) Viewed 10694 times
-
amol
- Advanced
- Posts: 231
- Joined: Tue Mar 29, 2005 5:00 am
Post
by amol » Fri Sep 23, 2016 5:10 am
Hi Steema Support
Thanks a lot. One more thing I want to also display the Markstip Left Side of the Bar as well.
Thanks in Advance
Plano Research