Adding area to chart modifies its StartColor

TeeChart for Microsoft Visual Studio .NET, Xamarin Studio (Android, iOS & Forms) & Monodevelop.
Post Reply
Matis
Newbie
Newbie
Posts: 7
Joined: Tue Aug 16, 2016 12:00 am

Adding area to chart modifies its StartColor

Post by Matis » Tue Aug 30, 2016 11:48 am

When I use area series, set up its gradient colors and then add it to chart, its gradient's StartColor is reset to some default value. MiddleColor and EndColor are correct. Please see the example below to reproduce:

Code: Select all

Area area = new Area();
area.AreaBrush.Gradient.StartColor = Color.GreenYellow;
area.AreaBrush.Gradient.MiddleColor = Color.BlueViolet;
area.AreaBrush.Gradient.EndColor = Color.Crimson;
area.AreaBrush.Gradient.UseMiddle = true;
area.AreaBrush.Gradient.Visible = true;
area.FillSampleValues();
chart.Series.Add(area);
I'm using version 4.1.2016.05120 and it worked fine in 2.0.2652.22325.

Christopher
Guru
Posts: 1603
Joined: Fri Nov 15, 2002 12:00 am

Re: Adding area to chart modifies its StartColor

Post by Christopher » Tue Aug 30, 2016 1:51 pm

Hello,

This defect has now been fixed, but as a workaround you can either do this:

Code: Select all

    private void InitializeChart()
    {
      Area area = new Area();
      area.Color = Color.GreenYellow;
      area.AreaBrush.Gradient.StartColor = Color.GreenYellow;
      area.AreaBrush.Gradient.MiddleColor = Color.BlueViolet;
      area.AreaBrush.Gradient.EndColor = Color.Crimson;
      area.AreaBrush.Gradient.UseMiddle = true;
      area.AreaBrush.Gradient.Visible = true;
      area.FillSampleValues();
      tChart1.Series.Add(area);
    }
or this:

Code: Select all

    private void InitializeChart()
    {
      Area area = new Area(tChart1.Chart);
      area.AreaBrush.Gradient.StartColor = Color.GreenYellow;
      area.AreaBrush.Gradient.MiddleColor = Color.BlueViolet;
      area.AreaBrush.Gradient.EndColor = Color.Crimson;
      area.AreaBrush.Gradient.UseMiddle = true;
      area.AreaBrush.Gradient.Visible = true;
      area.FillSampleValues();
    }
Best Regards,
Christopher Ireland / Development & Support
Steema Software
Avinguda Montilivi 33, 17003 Girona, Catalonia
Tel: 34 972 218 797
http://www.steema.com
Instructions - How to post in this forum

Matis
Newbie
Newbie
Posts: 7
Joined: Tue Aug 16, 2016 12:00 am

Re: Adding area to chart modifies its StartColor

Post by Matis » Wed Aug 31, 2016 10:42 am

Thanks for reply, the first workaround works. However, I have another problem. When I use transparency and want to hide area lines, 1px-wide gaps appear. Can be reproduced with:

Code: Select all

Area area = new Area();
area.Color = Color.GreenYellow;
area.AreaBrush.Gradient.StartColor = Color.GreenYellow;
area.AreaBrush.Gradient.MiddleColor = Color.BlueViolet;
area.AreaBrush.Gradient.EndColor = Color.Crimson;
area.AreaBrush.Gradient.UseMiddle = true;
area.AreaBrush.Gradient.Visible = true;
area.AreaBrush.Gradient.Transparency = 20;
area.AreaLines.Visible = false;
area.FillSampleValues();
chart.Series.Add(area);
This is how it looks:
teechart-lines.png
teechart-lines.png (34.93 KiB) Viewed 17735 times
This only happens if transparency is used. If I set GradientRelative to false, gaps dissapear, but some other problem pops up, so I'd like to avoid it. It worked in 2.0.2652.22325.

Christopher
Guru
Posts: 1603
Joined: Fri Nov 15, 2002 12:00 am

Re: Adding area to chart modifies its StartColor

Post by Christopher » Wed Aug 31, 2016 1:26 pm

Hello,

Yes, I can reproduce this issue here. However, it seems specific to a theme that did not exist in version 2. If you use an older theme, then this effect is not present, e.g.

Code: Select all

    private void InitializeChart()
    {
      tChart1.CurrentTheme = ThemeType.Opera;

      tChart1.Aspect.View3D = false;
      Area area = new Area();
      area.Color = Color.GreenYellow;
      area.AreaBrush.Gradient.StartColor = Color.GreenYellow;
      area.AreaBrush.Gradient.MiddleColor = Color.BlueViolet;
      area.AreaBrush.Gradient.EndColor = Color.Crimson;
      area.AreaBrush.Gradient.UseMiddle = true;
      area.AreaBrush.Gradient.Visible = true;
      area.AreaBrush.Gradient.Transparency = 20;
      area.AreaLines.Visible = false;
      area.FillSampleValues();
      tChart1.Series.Add(area);

      tChart1.Panel.Gradient.Visible = false;
      tChart1.Panel.Color = Color.White;

      tChart1.Walls.Back.Gradient.Visible = false;
      tChart1.Walls.Back.Color = Color.White;
    }
636082537139561153.jpg
636082537139561153.jpg (134.54 KiB) Viewed 17719 times
Best Regards,
Christopher Ireland / Development & Support
Steema Software
Avinguda Montilivi 33, 17003 Girona, Catalonia
Tel: 34 972 218 797
http://www.steema.com
Instructions - How to post in this forum

Matis
Newbie
Newbie
Posts: 7
Joined: Tue Aug 16, 2016 12:00 am

Re: Adding area to chart modifies its StartColor

Post by Matis » Wed Aug 31, 2016 2:09 pm

Unfortunately, this doesn't work for me if the data is irregular:

Code: Select all

Area area = new Area();
area.Color = Color.GreenYellow;
area.AreaBrush.Gradient.StartColor = Color.GreenYellow;
area.AreaBrush.Gradient.MiddleColor = Color.BlueViolet;
area.AreaBrush.Gradient.EndColor = Color.Crimson;
area.AreaBrush.Gradient.UseMiddle = true;
area.AreaBrush.Gradient.Visible = true;
area.AreaBrush.Gradient.Transparency = 20;
area.AreaLines.Visible = false;

var x = 0d;
for (int i = 0; i < 30; i++)
{
    x = random.NextDouble()*10 + x;
    var y = random.NextDouble()*5;
    area.Add(x, y);
}

chart.CurrentTheme = ThemeType.Opera;
chart.Series.Add(area);
This produces:
teechart-lines-2.png
teechart-lines-2.png (39.8 KiB) Viewed 17713 times

Christopher
Guru
Posts: 1603
Joined: Fri Nov 15, 2002 12:00 am

Re: Adding area to chart modifies its StartColor

Post by Christopher » Thu Sep 01, 2016 10:08 am

Hello,

The answer here is to change the SmoothingMode, e.g.

Code: Select all

    Random random = new Random();
    private void InitializeChart()
    {
      tChart1.CurrentTheme = ThemeType.Opera;
      tChart1.Graphics3D.SmoothingMode = SmoothingMode.HighSpeed;

      Area area = new Area();
      area.Color = Color.GreenYellow;
      area.AreaBrush.Gradient.StartColor = Color.GreenYellow;
      area.AreaBrush.Gradient.MiddleColor = Color.BlueViolet;
      area.AreaBrush.Gradient.EndColor = Color.Crimson;
      area.AreaBrush.Gradient.UseMiddle = true;
      area.AreaBrush.Gradient.Visible = true;
      area.AreaBrush.Gradient.Transparency = 20;
      area.AreaBrush.Gradient.GammaCorrection = true;
      area.LinePen.Visible = false;
      area.AreaLines.Visible = false;

      var x = 0d;
      for (int i = 0; i <= 30; i++)
      {
        x = random.NextDouble() * 10 + x;
        var y = random.NextDouble() * 5;
        area.Add(x, y);
      }

      tChart1.Series.Add(area);
    }
which gives me:
636083281774883694.jpg
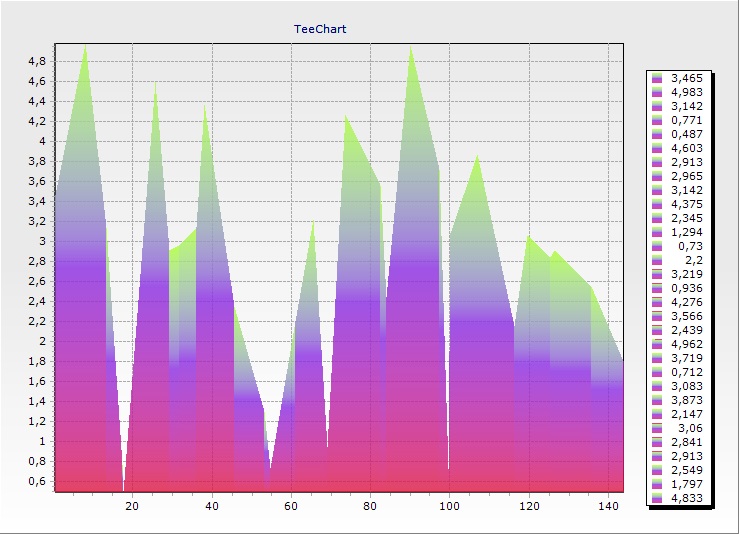
636083281774883694.jpg (119.01 KiB) Viewed 17706 times
FYI, you can see this effect outside of TeeChart, e.g. in a UserControl:

Code: Select all

  public partial class UserControl2 : UserControl
  {
    public UserControl2()
    {
      InitializeComponent();
    }

    Random rnd = new Random();
    protected override void OnPaint(PaintEventArgs e)
    {
      Func<Rectangle, Color, Color, Color, LinearGradientBrush> Gradient = (rect, startColor, middleColor, endColor) =>
      {
        LinearGradientBrush result = new LinearGradientBrush(rect, startColor, endColor, LinearGradientMode.Vertical);

        ColorBlend blend = new ColorBlend(3);
        blend.Colors[0] = startColor;
        blend.Colors[1] = middleColor;
        blend.Colors[2] = endColor;
        blend.Positions[0] = 0;
        blend.Positions[1] = 0.5F;
        blend.Positions[2] = 1;

        result.InterpolationColors = blend;
        result.GammaCorrection = false;

        return result;
      };

      Func<Point[], Rectangle> BoundingRect = (p) => 
      {
        Rectangle r = new Rectangle();

        if (p.GetUpperBound(0) > 1)
        {
          r.X = p[0].X;
          r.Width = 0;
          r.Y = p[0].Y;
          r.Height = 0;

          for (int t = 1; t <= p.GetUpperBound(0); t++)
          {
            if (p[t].X < r.Left)
            {
              r.Width = r.Right - p[t].X;
              r.X = p[t].X;
            }
            if (p[t].X > r.Right)
            {
              r.Width = r.Width + p[t].X - r.Right;
            }
            if (p[t].Y < r.Top)
            {
              r.Height = r.Bottom - p[t].Y;
              r.Y = p[t].Y;
            }
            if (p[t].Y > r.Bottom)
            {
              r.Height = r.Height + p[t].Y - r.Bottom;
            }
          }
        }

        return r;
      };

      Graphics g = e.Graphics;
      g.SmoothingMode = SmoothingMode.HighQuality;
      Rectangle bounds = this.Bounds;
      int count = 30;

      int width = bounds.Width / count;
      int trans = (int)Math.Round(255 * 0.6);

      Point oldTopRight = Point.Empty;

      for (int i = 0; i < count; i++)
      {
        int x0 = width * i;
        int y0 = rnd.Next(bounds.Height);
        int x1 = x0 + width;
        int y1 = bounds.Height;

        Point topLeft = new Point(x0, y0);
        Point topRight = new Point(x1, y0);
        Point bottomRight = new Point(x1, y1);
        Point bottomLeft = new Point(x0, y1);

        Point[] poly = new Point[] { oldTopRight == Point.Empty ? topLeft : oldTopRight, topRight, bottomRight, bottomLeft};

        Rectangle rect = new Rectangle(x0, y0, width, bounds.Height - (oldTopRight == Point.Empty ? y0 : Math.Min(oldTopRight.Y, y0)));

        LinearGradientBrush grad = Gradient(BoundingRect(poly), Color.FromArgb(trans, Color.GreenYellow), Color.FromArgb(trans, Color.BlueViolet), Color.FromArgb(trans, Color.Crimson));

        g.FillPolygon(grad, poly);

        oldTopRight = topRight;
      }
    }
  }
use of which gives me:
usercontrol.PNG
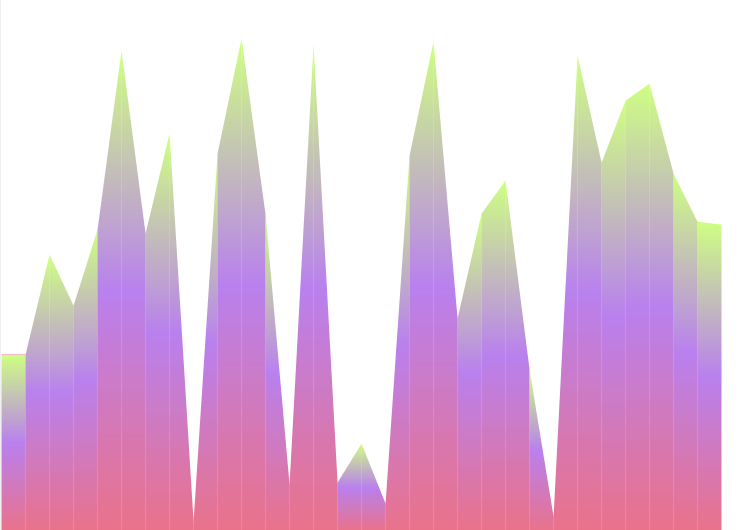
usercontrol.PNG (69.68 KiB) Viewed 17705 times
Best Regards,
Christopher Ireland / Development & Support
Steema Software
Avinguda Montilivi 33, 17003 Girona, Catalonia
Tel: 34 972 218 797
http://www.steema.com
Instructions - How to post in this forum

Matis
Newbie
Newbie
Posts: 7
Joined: Tue Aug 16, 2016 12:00 am

Re: Adding area to chart modifies its StartColor

Post by Matis » Mon Sep 05, 2016 8:48 am

Is it possible to disable antialiasing for area series but enable it for line series on the same chart? I'd like to try to work around the problem by drawing antialiased line series over not antialiased area. Or maybe there is a better workaround? Not antialiased area doesn't look too well...

Christopher
Guru
Posts: 1603
Joined: Fri Nov 15, 2002 12:00 am

Re: Adding area to chart modifies its StartColor

Post by Christopher » Tue Sep 06, 2016 7:38 am

Matis wrote:Is it possible to disable antialiasing for area series but enable it for line series on the same chart? I'd like to try to work around the problem by drawing antialiased line series over not antialiased area. Or maybe there is a better workaround? Not antialiased area doesn't look too well...
Unfortunately the GDI+ graphics SmoothingMode cannot be set to different values for different areas of the canvas. The workaround we offer is the one you discovered near the beginning of this thread - setting GradientRelative to true. Which problems did you experience with this setting?
Best Regards,
Christopher Ireland / Development & Support
Steema Software
Avinguda Montilivi 33, 17003 Girona, Catalonia
Tel: 34 972 218 797
http://www.steema.com
Instructions - How to post in this forum

Matis
Newbie
Newbie
Posts: 7
Joined: Tue Aug 16, 2016 12:00 am

Re: Adding area to chart modifies its StartColor

Post by Matis » Wed Sep 07, 2016 6:52 am

When I used GradientRelative then area's color became solid below y-value of 1. But nevermind, we decided to simply disable area's antialiasing for the time being. Thanks for the assistance.

Christopher
Guru
Posts: 1603
Joined: Fri Nov 15, 2002 12:00 am

Re: Adding area to chart modifies its StartColor

Post by Christopher » Wed Sep 07, 2016 8:42 am

Using the following code:

Code: Select all

    Random random = new Random();
    private void InitializeChart()
    {
      tChart1.CurrentTheme = ThemeType.Opera;

      Area area = new Area();
      area.Color = Color.GreenYellow;
      area.AreaBrush.Gradient.StartColor = Color.GreenYellow;
      area.AreaBrush.Gradient.MiddleColor = Color.BlueViolet;
      area.AreaBrush.Gradient.EndColor = Color.Crimson;
      area.AreaBrush.Gradient.UseMiddle = true;
      area.AreaBrush.Gradient.Visible = true;
      area.AreaBrush.Gradient.Transparency = 20;
      area.GradientRelative = false;
      area.LinePen.Visible = false;
      area.AreaLines.Visible = false;
      area.Origin = 0;
      area.UseOrigin = true;

      var x = 0d;
      for (int i = 0; i <= 30; i++)
      {
        x = random.NextDouble() * 10 + x;
        double y = random.NextDouble();
        bool flag = random.NextDouble() < 0.5;
        y = flag ? y : y * -1;
        area.Add(x, y);
      }

      tChart1.Series.Add(area);
    }
I get this chart:
636088416560987456.jpg
636088416560987456.jpg (110.95 KiB) Viewed 17657 times
Is this not what you expect?
Best Regards,
Christopher Ireland / Development & Support
Steema Software
Avinguda Montilivi 33, 17003 Girona, Catalonia
Tel: 34 972 218 797
http://www.steema.com
Instructions - How to post in this forum

Matis
Newbie
Newbie
Posts: 7
Joined: Tue Aug 16, 2016 12:00 am

Re: Adding area to chart modifies its StartColor

Post by Matis » Thu Sep 08, 2016 8:15 am

I reproduced the problem in a sample app. It's not actually below 1 and not solid color (that was true for the data and settings in my actual application), but rather a "restarted" gradient below lowest y-value of an area. It happens when there are more multiple series. It looks like a rectangle is drawn below an area chart and its gradient is drawn separately from area above it:
teechart-gradient.png
teechart-gradient.png (46.44 KiB) Viewed 17648 times

Code: Select all

            var data = GetData();

            Area area = new Area();
            area.Color = StartColor;
            area.AreaBrush.Gradient.StartColor = Color.GreenYellow;
            area.AreaBrush.Gradient.MiddleColor = Color.BlueViolet;
            area.AreaBrush.Gradient.EndColor = Color.Crimson;
            area.AreaBrush.Gradient.UseMiddle = true;
            area.AreaBrush.Gradient.Visible = true;
            area.AreaBrush.Gradient.Transparency = 20;
            area.AreaLines.Visible = false;
            area.GradientRelative = false;
            SetData(area, data);

            Line line = new Line();
            line.Color = Color.AliceBlue;
            var newData = data.Select(p => new Point(p.X, p.Y - 3));
            SetData(line, newData);

            chart.Series.Add(area);
            chart.Series.Add(line);

Christopher
Guru
Posts: 1603
Joined: Fri Nov 15, 2002 12:00 am

Re: Adding area to chart modifies its StartColor

Post by Christopher » Thu Sep 08, 2016 9:12 am

Hello,

Okay, thank you, I think I can see what's happening - if I use this code:

Code: Select all

    Random random = new Random();
    private void InitializeChart()
    {
      tChart1.CurrentTheme = ThemeType.Opera;
      tChart1.Aspect.View3D = false;

      Area area = new Area();
      area.Color = Color.GreenYellow;
      area.AreaBrush.Gradient.StartColor = Color.GreenYellow;
      area.AreaBrush.Gradient.MiddleColor = Color.BlueViolet;
      area.AreaBrush.Gradient.EndColor = Color.Crimson;
      area.AreaBrush.Gradient.UseMiddle = true;
      area.AreaBrush.Gradient.Visible = true;
      area.AreaBrush.Gradient.Transparency = 20;
      area.GradientRelative = false;
      area.LinePen.Visible = false;
      area.AreaLines.Visible = false;
      //area.Origin = 0;
      //area.UseOrigin = true;

      var x = 0d;
      for (int i = 0; i <= 30; i++)
      {
        x = random.NextDouble() * 10 + x;
        double y = random.NextDouble();
        bool flag = random.NextDouble() < 0.5;
        y = flag ? y : y * -1;
        area.Add(x, y);
      }

      tChart1.Series.Add(area);
    }
and then use the mouse to scroll the chart upwards, I get this:
636089297353293595.jpg
636089297353293595.jpg (93.83 KiB) Viewed 17639 times
I have added this to our issue tracker with id=1625.
Best Regards,
Christopher Ireland / Development & Support
Steema Software
Avinguda Montilivi 33, 17003 Girona, Catalonia
Tel: 34 972 218 797
http://www.steema.com
Instructions - How to post in this forum

Post Reply