TeeChart for Microsoft Visual Studio .NET, Xamarin Studio (Android, iOS & Forms) & Monodevelop.
-
rpt
- Newbie

- Posts: 24
- Joined: Wed Aug 09, 2006 12:00 am
Post
by rpt » Wed Aug 17, 2016 3:35 pm
Hi
I am trying to achieve this.
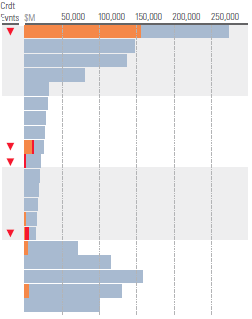
- graph-loan-cohort.png (4.61 KiB) Viewed 14949 times
I am facing below challenges
1)Can i show a custom y axis as you can see in image little *Red* V icons
2) Also is there a way i can shade gray couple horizontal bars e.g i want to shade alternate 5 bars
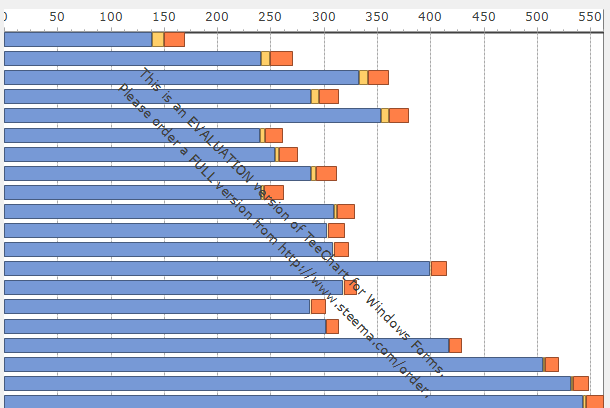
This is i am able to achieve.
-
Attachments
-
- graph-loan-cohort-progess.png (13.87 KiB) Viewed 14937 times
-
Christopher
- Guru
- Posts: 1603
- Joined: Fri Nov 15, 2002 12:00 am
Post
by Christopher » Thu Aug 18, 2016 11:01 am
Hello,
Very roughly, you could start by something a little like this:
Code: Select all
    Steema.TeeChart.Styles.HorizBar hBar;
    Steema.TeeChart.Tools.GridBand band;
    private void InitializeChart()
    {
      tChart1.Aspect.View3D = false;
      tChart1.Legend.Visible = false;
      hBar = new HorizBar(tChart1.Chart);
      hBar.FillSampleValues(20);
      hBar.Marks.Visible = false;

      band = new GridBand(tChart1.Chart);
      band.Axis = tChart1.Axes.Left;
      band.Band1.Color = Color.White;
      band.Band2.Color = Color.LightGray;

      tChart1.Panel.MarginLeft = 10;

      Axis leftAxis = tChart1.Axes.Left;
      leftAxis.Increment = 5;
      leftAxis.AxisPen.Visible = false;
      leftAxis.Labels.Font.Color = Color.Transparent;
      leftAxis.Ticks.Visible = false;
      leftAxis.MinorTicks.Visible = false;

      tChart1.AfterDraw += TChart1_AfterDraw;
    }

    private void TChart1_AfterDraw(object sender, Graphics3D g)
    {
      g.Pen.Color = Color.Red;
      g.HorizontalLine(0, tChart1.Axes.Bottom.IStartPos, tChart1.Axes.Left.IStartPos);
      g.TextOut(20, tChart1.Axes.Left.IStartPos - 12, "text");

      int fourthBar = hBar.CalcYPos(4);

      g.Brush.Color = Color.Red;
      g.Triangle(new Point(30, fourthBar), new Point(40, fourthBar), new Point(35, fourthBar + 10), 0);
    }
-
rpt
- Newbie
- Posts: 24
- Joined: Wed Aug 09, 2006 12:00 am
Post
by rpt » Thu Aug 18, 2016 2:30 pm
Thanks Chris for your help.
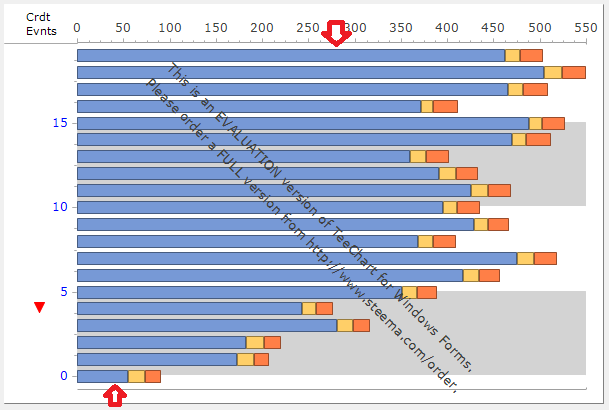
Is there a way i can cover exactly 5 bars by gridband. As of now Gridband start middle of ticks
Also i am not able to get rid of bottom axes and the spaces highligted in Red
Note: Left Axis ticks are temporary
Code: Select all
Chart chart = param.ChartInstance;
            TChart tchart = param.TeeChart;
            tchart.AfterDraw += tchart_AfterDraw;
            tchart.Aspect.View3D = false;
            chart.Axes.Custom.Clear();

            for (int i = 0; i < 3; i++)
            {
                Steema.TeeChart.Styles.HorizBar loanBar = new HorizBar(chart);
               // loanBar.BarHeightPercent = 100;
                //Bar mstarForecastedLosses = new Bar(chart);
                //Bar mstarBearishLossesBar = new Bar(chart);

                loanBar.FillSampleValues(20);
                //mstarForecastedLosses.FillSampleValues(4);
                //mstarBearishLossesBar.FillSampleValues(4);

                loanBar.MultiBar = Steema.TeeChart.Styles.MultiBars.Stacked;
              //  loanBar.SideMargins = false;
                loanBar.Legend.Visible = false;
                loanBar.Marks.Visible = false;
              //  mstarForecastedLosses.MultiBar = Steema.TeeChart.Styles.MultiBars.Stacked;
              //  mstarBearishLossesBar.MultiBar = Steema.TeeChart.Styles.MultiBars.Stacked;

                loanBar.VertAxis = Steema.TeeChart.Styles.VerticalAxis.Left;
                loanBar.HorizAxis = Steema.TeeChart.Styles.HorizontalAxis.Top;
            }


            chart.Header.Visible = false;
          //  chart.Panel.Color = Color.Blue;
           // chart.Panel.BorderRound = 5;

            //chart.Panel.MarginBottom = 0D;
            //chart.Panel.MarginLeft = 4.0D;
            //chart.Panel.MarginRight = 0D;
            //chart.Panel.MarginTop = 0D;
            //chart.Panel.MarginUnits = Steema.TeeChart.PanelMarginUnits.Pixels;


            Axis top = new Axis(true, false, chart);
            chart.Axes.Custom.Add(top);
            top.Grid.Visible = true;

            band = new GridBand(chart);
            band.Axis = tchart.Axes.Left;
            band.Band1.Color = Color.White;
            band.Band2.Color = Color.LightGray;

            tchart.Panel.MarginLeft = 7;

            Axis leftAxis = tchart.Axes.Left;
            leftAxis.Increment = 5;
            leftAxis.AxisPen.Visible = false;
            leftAxis.Labels.Font.Color = Color.Blue;
            leftAxis.Ticks.Visible = true;
            leftAxis.MinorTicks.Visible = true;
            leftAxis.Grid.Visible = true;

            Axis bottomAxis = tchart.Axes.Bottom;
            bottomAxis.AxisPen.Color = Color.Transparent;
            bottomAxis.AxisPen.Visible = false;
            bottomAxis.Labels.Font.Color = Color.Transparent;
            bottomAxis.Ticks.Visible = false;
            bottomAxis.MinorTicks.Visible = false;
            bottomAxis.Grid.Visible = false;
-
Attachments
-
- graph-loan-cohort-progess.png (12.26 KiB) Viewed 14923 times
-
Christopher
- Guru
- Posts: 1603
- Joined: Fri Nov 15, 2002 12:00 am
Post
by Christopher » Fri Aug 19, 2016 10:46 am
Hello,
You're very welcome.
Possibly the quickest way to achieve this is again to draw elements on the chart, e.g.
Code: Select all
    Steema.TeeChart.Styles.HorizBar hBar;
    private void InitializeChart()
    {
      tChart1.Aspect.View3D = false;
      tChart1.Legend.Visible = false;
      hBar = new HorizBar(tChart1.Chart);
      hBar.FillSampleValues(20);
      hBar.Marks.Visible = false;
      tChart1.Panel.MarginLeft = 10;
      tChart1.Axes.Left.Visible = false;
      tChart1.AfterDraw += TChart1_AfterDraw;
      tChart1.BeforeDrawAxes += TChart1_BeforeDrawAxes;
    }

    private List<int> val = new List<int>();
    private void TChart1_BeforeDrawAxes(object sender, Graphics3D g)
    {
      val.Clear();

      for (int i = 1; i < hBar.Count; i+=5)
      {
        double middle = (hBar.YValues[i] - hBar.YValues[i - 1]) / 2.0;
        val.Add(hBar.CalcYPosValue(hBar.YValues[i - 1] - middle));
      }

      Rectangle r;

      for (int i = 1; i < val.Count; i++)
      {
        Color col = i % 2 == 0 ? Color.White : Color.LightGray;
        g.Brush.Color = col;
        g.Pen.Color = col;
        r = Utils.FromLTRB(tChart1.Axes.Bottom.IStartPos, val[i - 1], tChart1.Axes.Bottom.IEndPos, val[i]);
        g.Rectangle(r);
      }
    }

    private void TChart1_AfterDraw(object sender, Graphics3D g)
    {
      g.Pen.Color = Color.Red;
      g.HorizontalLine(0, tChart1.Axes.Bottom.IStartPos, tChart1.Axes.Left.IStartPos);
      g.TextOut(20, tChart1.Axes.Left.IStartPos - 12, "text");

      int fourthBar = hBar.CalcYPos(4);

      g.Brush.Color = Color.Red;
      g.Triangle(new Point(30, fourthBar), new Point(40, fourthBar), new Point(35, fourthBar + 10), 0);
    }
-
rpt
- Newbie
- Posts: 24
- Joined: Wed Aug 09, 2006 12:00 am
Post
by rpt » Mon Aug 22, 2016 3:46 pm
Legend and Chart top is overlapping , Also grid lines are not showing from top axis
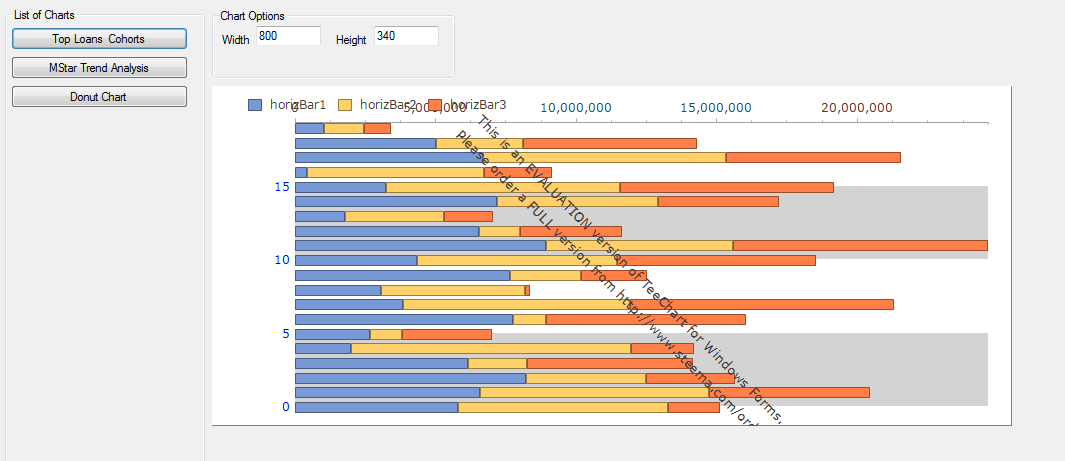
- graphTopLoanCohorts.png (20.88 KiB) Viewed 14863 times
Code: Select all
 private void SetCommonProperties(ChartBuilderParam param)
        {
            Chart chart = param.ChartInstance;
            TChart tchart = param.TeeChart;

            tchart.Aspect.View3D = false;

            chart.Header.Visible = false;

            tchart.Legend.Alignment = Steema.TeeChart.LegendAlignments.Top;
            tchart.Legend.DrawBehind = false;
            tchart.Legend.Pen.Visible = false;
            tchart.Legend.Shadow.Visible = false;
            tchart.Legend.Transparent = true;
            tchart.Legend.VertMargin =55;
            tchart.Legend.CustomPosition = true;
            tchart.Legend.Top = 10;
            tchart.Legend.Left = 30;

            tchart.Axes.Automatic = true;


        }

        public ChartBuilderParam BuildTopLoansCohortChart( ChartBuilderParam param)
        {
            Chart chart = param.ChartInstance;
            TChart tchart = param.TeeChart;

            SetCommonProperties(param);

          //  tchart.AfterDraw += tchart_AfterDraw;

            tchart.Panel.MarginLeft = 7;

            GridBand band = new GridBand(chart);
            band.Axis = tchart.Axes.Left;
            band.Band1.Color = Color.White;
            band.Band2.Color = Color.LightGray;


            Axis leftAxis = tchart.Axes.Left;
            leftAxis.IncrementOffset = 0;
            leftAxis.Increment = 5;
            leftAxis.AxisPen.Visible = false;
            leftAxis.Labels.Font.Color = Color.Blue;
            leftAxis.Ticks.Visible = false;
            leftAxis.MinorTicks.Visible = false;
            leftAxis.Grid.Visible = false;
            leftAxis.MinimumOffset = 0;

            Axis topAxis = tchart.Axes.Top;
            topAxis.Chart = chart;
            topAxis.Grid.Visible = true;
            topAxis.Grid.DrawEvery = 2;
            topAxis.Grid.Fill.Color = Color.Blue;


            Random rnd = new Random();

            for (int i = 0; i < 3; i++)
            {
                Steema.TeeChart.Styles.HorizBar loanBar = new HorizBar(chart);

                loanBar.MultiBar = Steema.TeeChart.Styles.MultiBars.Stacked;
                loanBar.SideMargins = false;

                loanBar.Marks.Visible = false;
                loanBar.VertAxis = Steema.TeeChart.Styles.VerticalAxis.Left;
                loanBar.HorizAxis = Steema.TeeChart.Styles.HorizontalAxis.Top;
                for (int k = 1; k <= 20; k++)
                {
                    loanBar.Add(rnd.Next(100000,10000000));
                }
            }

            return param;
        }
-
Christopher
- Guru
- Posts: 1603
- Joined: Fri Nov 15, 2002 12:00 am
Post
by Christopher » Tue Aug 23, 2016 7:44 am
Hello,
Would you please be so kind as to retouch your example so I can compile and run it here? I'm afraid I do not have access to your ChartBuilderParam object.
-
rpt
- Newbie
- Posts: 24
- Joined: Wed Aug 09, 2006 12:00 am
Post
by rpt » Tue Aug 23, 2016 12:42 pm
-
Christopher
- Guru
- Posts: 1603
- Joined: Fri Nov 15, 2002 12:00 am
Post
by Christopher » Tue Aug 23, 2016 3:06 pm
Hello,
Thank you for your code. The problem can be corrected by adding one line to SetCommonProperties():
Code: Select all
            tchart.Legend.CustomPosition = true;
            tchart.Legend.Top = 10;
            tchart.Legend.Left = 30;

            tchart.Panel.MarginTop = 10;
The reason the MarginTop is necessary is because you have set CustomPosition to true.
-
rpt
- Newbie
- Posts: 24
- Joined: Wed Aug 09, 2006 12:00 am
Post
by rpt » Tue Aug 23, 2016 6:28 pm
Thank You , this worked