Page 1 of 1
Why do I only have 2 labels on left axis?
Posted: Thu Apr 03, 2014 10:08 am
by 13050364
Hi
Ive set the following to define the left axis;
myChart.Axes.Left.Labels.Exponent = true;
myChart.Axes.Left.Labels.ValueFormat = "00e-0";
However when I plot a curve on the line only 2 labels are shown; 0 and 1.3(e-13) despite the fact my plot extend from e-15 to e-18
Do I need to set some value to have more labels shown on the left axis
Thanks!
Re: Why do I only have 2 labels on left axis?
Posted: Fri Apr 04, 2014 7:21 pm
by 13050364
Anyone with any ideas?
It seems like when you do;
myChart.Axes.Left.Labels.Exponent = true
The labels don't display. However if
myChart.Axes.Left.Labels.Exponent = false
then the labels do show but they are all zero because the values are so tiny.
Re: Why do I only have 2 labels on left axis?
Posted: Fri Apr 04, 2014 9:15 pm
by 13050364
I wrote a test program and the following worked.
spectrumChart.Axes.Left.Labels.Exponent = true;
spectrumChart.Axes.Left.Labels.ValueFormat = "#.0 \"x10\" E+0";
Will test on our own project later.
Re: Why do I only have 2 labels on left axis?
Posted: Mon Apr 07, 2014 1:28 pm
by Christopher
Dave,
Dave wrote:
spectrumChart.Axes.Left.Labels.Exponent = true;
spectrumChart.Axes.Left.Labels.ValueFormat = "#.0 \"x10\" E+0";
Will test on our own project later.
Please let us know if we can help you further in this area.
Re: Why do I only have 2 labels on left axis?
Posted: Tue Apr 08, 2014 1:49 pm
by 13050364
Hi Christopher
Apparently it works fine when the exponent is -10 or less. However for -10,-11, 12 etc the labels aren't displayed. We've got round this by labelling the axis uJ instead of J. So weve effectively multiplied the values by 1 million and everything is ok. This issue may have been fixed in a later version of Teechart. The one we are using is about 4 years old I think.
Re: Why do I only have 2 labels on left axis?
Posted: Wed Apr 09, 2014 1:18 pm
by Christopher
Dave wrote:The one we are using is about 4 years old I think.
In the latest release, the following code:
private void InitializeChart()
{
tChart1.Aspect.View3D = false;
tChart1.Legend.Visible = false;
Line series1 = new Line(tChart1.Chart);
Random rnd = new Random();
for (int i = 0; i < 10; i++)
{
series1.Add(i, rnd.NextDouble() * 10000000000000);
}
tChart1.Axes.Left.Labels.Exponent = true;
tChart1.Axes.Left.Labels.ValueFormat = "#.0 \"x10\" E+0";
}
gives this:
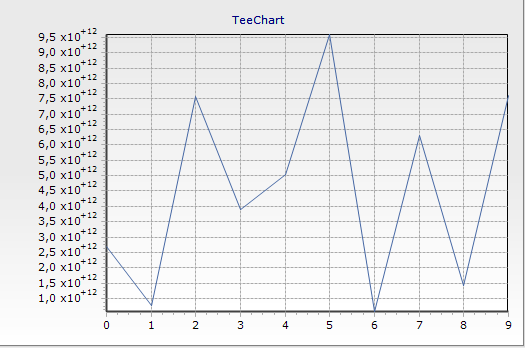
- exponential.PNG (22.51 KiB) Viewed 12451 times
Re: Why do I only have 2 labels on left axis?
Posted: Sun May 04, 2014 9:14 am
by 13050364
Hi Christopher
We are using TeeChart version 3.5.3187.15585 and C#.NET
Bizarrely we found if the exponent was too small it didn't draw the labels. We have it working fine now by changing the units which allowed us to reduce the exponent.
Re: Why do I only have 2 labels on left axis?
Posted: Mon May 05, 2014 9:50 am
by Christopher
Hello Dave,
Dave wrote:
We are using TeeChart version 3.5.3187.15585 and C#.NET
You may consider upgrading your version of TeeChart to enjoy all the improvements that have been made to it over the years
