TeeChart VCL for Borland/CodeGear/Embarcadero RAD Studio, Delphi and C++ Builder.
-
HMArnold
- Newbie

- Posts: 1
- Joined: Wed Dec 27, 2023 12:00 am
Post
by HMArnold » Fri Dec 29, 2023 10:02 am
The TCurveFittingFunction() works perfectly and displays on the graph. Also working perfectly is the GetCurveYValue()
I was hoping to use it to be able curve fitting function to estimate the Y values for missing data points on a time series.
We're plotting bird nesting survey values, and for some years the results aren't available, but we would like to use the TCurveFittingFunction() to estimate the best possible estimate values for the missing years.
I have tried using Null values for the missing data points, but they seem to always go into the curve function calculation as zero values.
As near as I can tell, Curve.IncludeNulls := false; has no effect.
Is there a way to insert non calculating place holders into a curve data source that don't get calculated as zero?
It appears there were some posts many years back saying it was on the wish list for VCL, but I can't find anything about it.
Any suggestions appreciated
-
Yeray
- Site Admin

- Posts: 9534
- Joined: Tue Dec 05, 2006 12:00 am
- Location: Girona, Catalonia
-
Contact:
Post
by Yeray » Wed Jan 03, 2024 4:25 pm
Hello,
I'm not sure if this solves the problem you are describing but I've done a simple example with my proposal.
In the example I'm populating a
TPointSeries with 14 values, from 0 to 14 with a hole at
XValue=7.
Then, I'm adding a
TFasTLineseries with a
TCurveFittingFunction.
Finally, I'm calculating the Interpolation point with the method from here and I'm adding the given value in another
TPointSeries.
Here the code:
Code: Select all
uses Chart, Series, CurvFitt;

var Chart1: TChart;

procedure TForm1.FormCreate(Sender: TObject);
var i: Integer;
begin
  Chart1:=TChart.Create(Self);

  with Chart1 do
  begin
    Parent:=Self;
    Align:=alClient;
    Color:=clWhite;
    Gradient.Visible:=False;
    Walls.Back.Color:=clWhite;
    Walls.Back.Gradient.Visible:=False;
    Legend.Hide;
    View3D:=False;

    with TPointSeries(AddSeries(TPointSeries)) do
    begin
      AddXY(0, 50+Random*25);
      for i:=1 to 14 do
        if i<>7 then
          AddXY(i, YValues.Last+Random*10-5);
    end;

    with TFastLineSeries(AddSeries(TFastLineSeries)) do
    begin
      SetFunction(TCurveFittingFunction.Create(Self));
      DataSource:=Series[0];
    end;

    Draw;

    with TPointSeries(AddSeries(TPointSeries)) do
    begin
      Marks.Show;
      Marks.ArrowLength:=10;
      AddXY(7, InterpolateLineSeries(Series[1], 7));
    end;
  end;
end;

function TForm1.InterpolateLineSeries(Series: TChartSeries;
  XValue: Double): Double;
begin
  result:=InterpolateLineSeries(Series,Series.FirstDisplayedIndex,Series.LastValueIndex,XValue);
end;

function TForm1.InterpolateLineSeries(Series: TChartSeries;
  FirstIndex, LastIndex: Integer; XValue: Double): Double;
var
  Index: Integer;
  dx,dy: Double;
begin
  for Index:=FirstIndex to LastIndex do
    if Series.XValues.Value[Index]>XValue then break;

  //safeguard
  if (Index<1) then Index:=1
  else if (Index>=Series.Count) then Index:=Series.Count-1;

  // y=(y2-y1)/(x2-x1)*(x-x1)+y1
  dx:=Series.XValues.Value[Index] - Series.XValues.Value[Index-1];
  dy:=Series.YValues.Value[Index] - Series.YValues.Value[Index-1];

  if (dx<>0) then
    result:=dy*(XValue - Series.XValues.Value[Index-1])/dx + Series.YValues.Value[Index-1]
  else result:=0;
end;
Here the result:
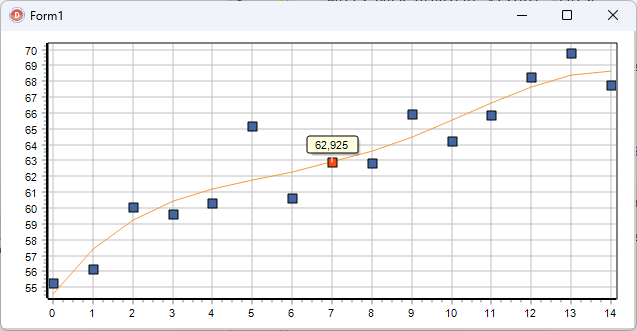
- CurveFitting.png (15.41 KiB) Viewed 2190 times


