Page 2 of 2
Re: Stepping as stacked area series to/from zero values
Posted: Thu May 18, 2023 2:23 pm
by 16492753
More information: This is income in retirement. The total value of all series increases by about 3% per year, resulting in a smooth line at the top. When income from an account starts or stops, it needs to step up or down, not go at an angle, which would not visually represent the data well.
Does that make sense?
Ed Dressel
Re: Stepping as stacked area series to/from zero values
Posted: Tue May 30, 2023 2:42 pm
by 16492753
Put another way: for the data, the values increase ~3% for each additional X value. The chart should have a top line that reflects that, and when an account drops off, it should step down; when it begins, it should step up. Does that make sense?
Re: Stepping as stacked area series to/from zero values
Posted: Wed Jun 07, 2023 1:54 pm
by 16492753
Hello?
Re: Stepping as stacked area series to/from zero values
Posted: Thu Jun 08, 2023 7:37 am
by yeray
Hello,
Sorry for the lack of reply here.
I'm still trying to understand what's wrong with the attempts in the original project.
For example, what's the problem with the first one?
- Project1_2023-06-08_09-35-10.png (24.77 KiB) Viewed 16192 times
You said this about the
UpdateChart1 approach:
Test Always #? wrote: ↑Mon Mar 20, 2023 8:34 pm
UpdateChart1 shows the chart correctly but doesn't do the stepping.
But I don't see the problem.
Re: Stepping as stacked area series to/from zero values
Posted: Wed Jun 14, 2023 2:04 pm
by 16492753
Hello?
Re: Stepping as stacked area series to/from zero values
Posted: Wed Jun 14, 2023 2:29 pm
by yeray
Hello,
Did you see my last reply?
Re: Stepping as stacked area series to/from zero values
Posted: Wed Sep 27, 2023 3:34 pm
by 16596488
Sorry, I missed your reply.
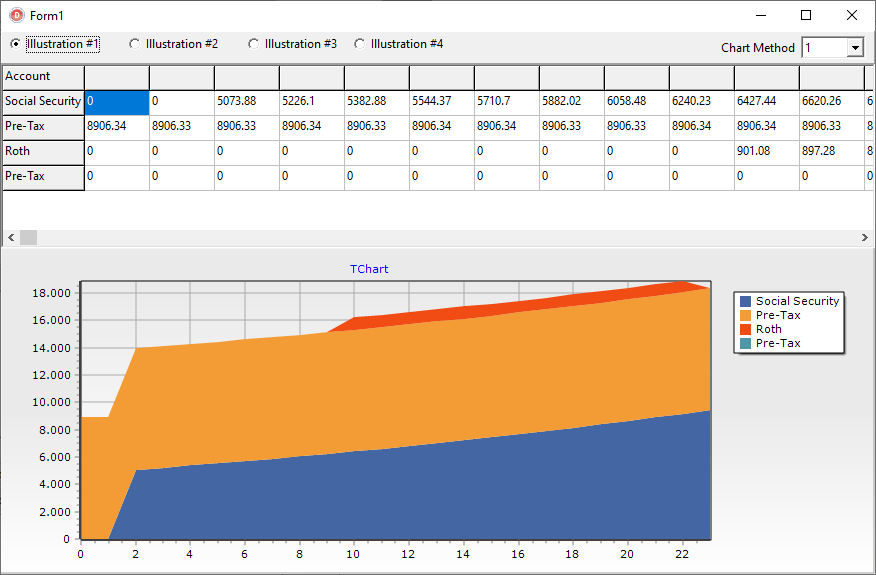
I don't want the angled lines--like the blue line that goes from 1 to 2. It should be a vertical line at 2, and the yellow line as well. It is more of an on/off value, not something that gradually gets there. (This can be done in a bar chart a lot easier, but the area chart communicates better the continuality of time better than a bar, and stepping up/down communicates turning it on/off).
Re: Stepping as stacked area series to/from zero values
Posted: Wed Oct 04, 2023 9:39 am
by yeray
Hello,
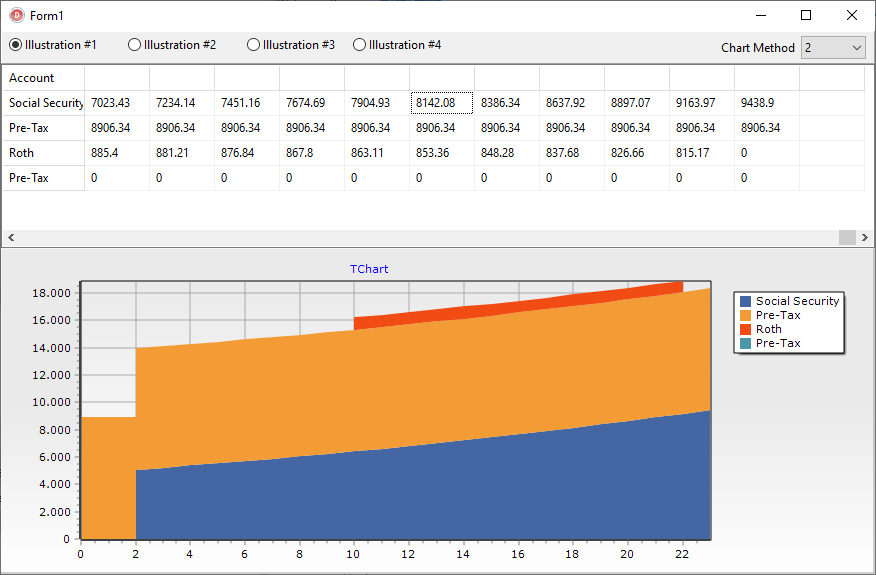
Then, you want illustration #1 to look like in "method 2".
- Project1_2023-10-04_11-29-39.png (25.13 KiB) Viewed 13833 times
The last down step in the red area is a problem?
If it's a problem, how would you draw it? The sum of data at point x=22 is 9.163,97+8.906,34+815,17=18.885,48, while the sum of data at the last point (x=23) is 9.438,9+8.906,34=18.345,24. So that looks like a down step in the values, isn't it?