TeeChart VCL for Borland/CodeGear/Embarcadero RAD Studio, Delphi and C++ Builder.
-
Bruce
- Newbie

- Posts: 5
- Joined: Fri Jul 31, 2020 12:00 am
Post
by Bruce » Wed Apr 06, 2022 7:37 pm
Hi
I generate some graphs with elliptical boundaries around data points (see attachment with magenta ellipses). These ellipses represent, say, 1 sigma uncertainties for individual data points. I would like to be able to colour the interior of each ellipse, with variable opacity and maybe gradient according to values in some other variable in a dataset.
Please could you advise me whether there is currently any option in TeeChart to fill inside some calculated/defined boundary (like the ellipses in the attached image) and whether it would also be possible to colour according to a third data variable?
Any advice for how to achieve this (if possible with current versions of TeeChart) would be much appreciated.
Thanks
Bruce
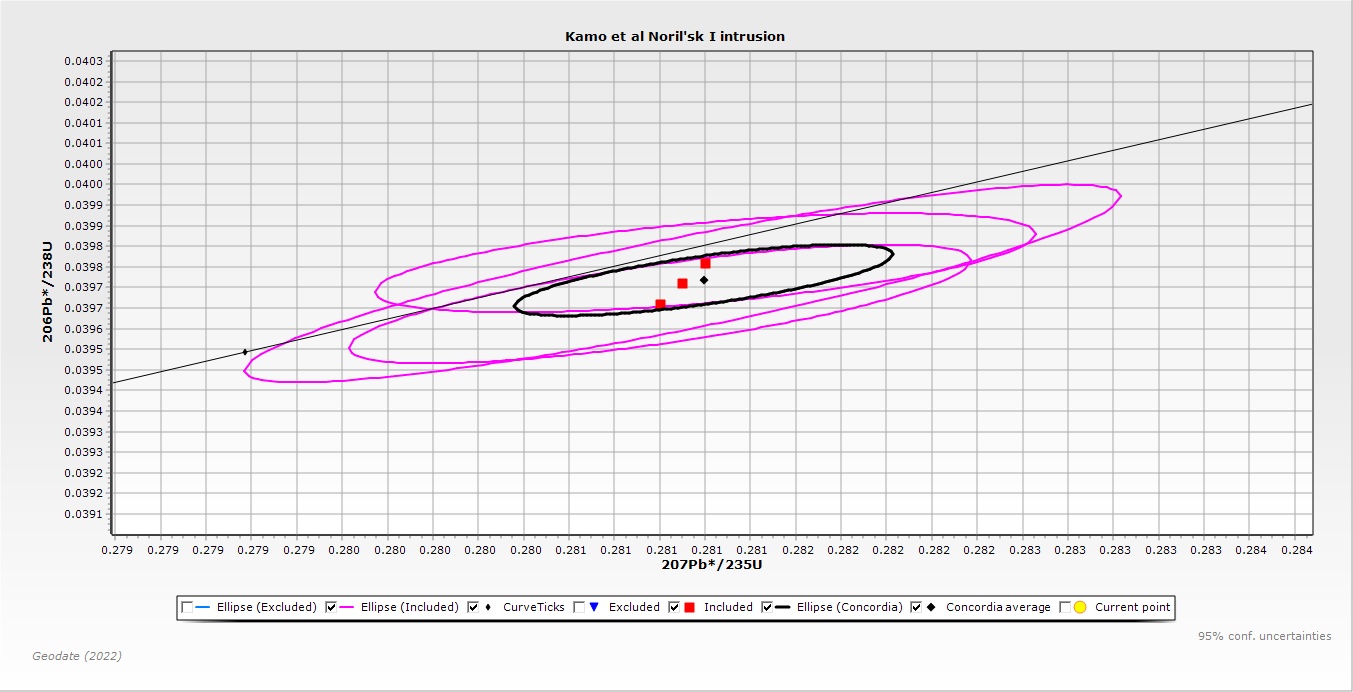
- Example Concordia plot.jpg (217.11 KiB) Viewed 4757 times
Bruce
-
Marc
- Site Admin

- Posts: 1214
- Joined: Thu Oct 16, 2003 4:00 am
- Location: Girona
-
Contact:
Post
by Marc » Fri Apr 08, 2022 2:56 pm
Hello Bruce,
You could take the point values that you use to plot the data, converting them to pixel locations using:
Series1.CalcXPosValue(value) and Series1.CalcYPosValue(value)
..or loop through the indexes of the points using:
Series1.CalcXPos(idx) and Series1.CalcYPos(idx)
..and adding them to an array of TPoints. You can then plot the array in the OnAfterDraw event using:
Before you plot the polygon, set the Brush to fill as you require.
eg.
Code: Select all
  Chart1.Canvas.Brush.Gradient.StartColor := clRed;  //can use (a)rgb colours
  Chart1.Canvas.Brush.Gradient.EndColor := clYellow;
  Chart1.Canvas.Brush.Gradient.Visible := True;

  Chart1.Canvas.Polygon(yourArray);
Regards,
Marc Meumann
Steema Support
-
Bruce
- Newbie
- Posts: 5
- Joined: Fri Jul 31, 2020 12:00 am
Post
by Bruce » Tue Apr 12, 2022 8:59 pm
Thanks. I am missing something though and am not sure what the associations are.
What is the array definition meant to be? is it something like
or should this be TPoints, in which case TPoints must be defined in some unit I am not aware of.
When adding the pixel location data to the array, I presume that this should be something like
Code: Select all
for i := 1 to N   // N is count for existing Series dataset
  MyArray[i].Create(Xloc,Yloc);
end;
but this does not seem to work.
Any help would be much appreciated
Thanks
Bruce
Bruce
-
Marc
- Site Admin
- Posts: 1214
- Joined: Thu Oct 16, 2003 4:00 am
- Location: Girona
-
Contact:
Post
by Marc » Tue Apr 19, 2022 8:10 am
Hello Bruce,
This example would go some way to the goal, proof of concept. You can make adjustments as necessary:
Code: Select all
procedure TForm1.Chart1AfterDraw(Sender: TObject);
var i : Integer;
    myPoints : Array of TPoint;
begin
  Chart1.Canvas.Brush.Gradient.StartColor := clRed;  //can use (a)rgb colours
  Chart1.Canvas.Brush.Gradient.EndColor := clYellow;
  Chart1.Canvas.Brush.Gradient.Visible := True;

  SetLength(myPoints, Series1.Count);
  for i:= 0 to Series1.Count-1 do
  Begin
    myPoints[i] := TPoint.Create(Series1.CalcXPos(i),Series1.CalcYPos(i));
  End;

  Chart1.Canvas.Polygon(myPoints);
end;
Regards,
Marc