Page 1 of 1
Stack two bars on top of each other....
Posted: Tue May 26, 2020 5:57 pm
by 17586478
Hello,
This is my first time post here

License: TeeChart VCL Std with source...
I am creating the Current.jpg bargraphs programmatically in Delphi Rio and display them in Fast-Report VCL. I haven't found a way to stack two bars on the same X position like in Goal.jpg screenshot..
Is this possible using my version of TeeChart? If yes, can I also smooth my red Current.jpg curve graph so it looks more like the blue one in Goal.jpg..?
Thanks a lot for help or comments on this.
best regards Tor
Re: Stack two bars on top of each other....
Posted: Thu May 28, 2020 11:18 am
by yeray
Hello,
Here a simple example:
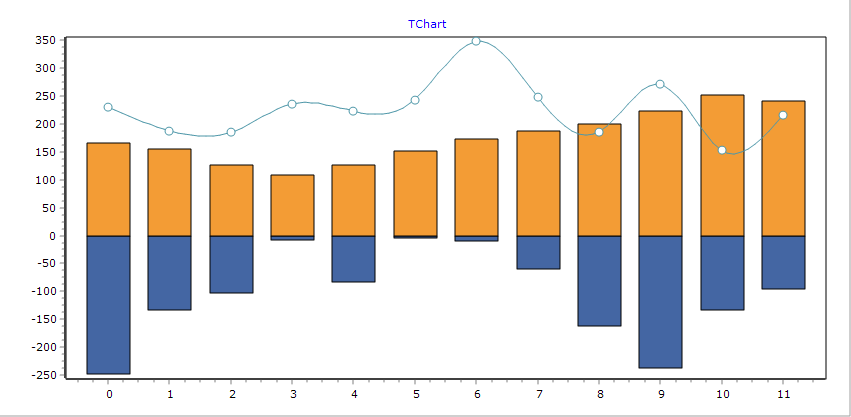
- Project1_2020-05-28_13-23-16.png (17.87 KiB) Viewed 6727 times
You basically need to set the
TBarSeries MultiBar property
mbStacked and use an additional
TLineSeries with a
TSmoothingFunction to show a smoothed line while still showing only a few (source) points:
Code: Select all
uses Series, TeeSpLine;

procedure TForm1.FormCreate(Sender: TObject);
var i,j: Integer;
    SourceSeries: TPointSeries;
    SmoothSeries: TLineSeries;
    SmoothFun: TSmoothingFunction;
begin
  Chart1.View3D:=False;
  Chart1.Gradient.Visible:=False;
  Chart1.Color:=clWhite;
  Chart1.Walls.Back.Gradient.Visible:=False;
  Chart1.Walls.Back.Color:=clWhite;
  Chart1.Legend.Hide;
  Chart1.Axes.Bottom.Grid.Hide;
  Chart1.Axes.Left.Grid.Hide;

  for i:=0 to 1 do
    with TBarSeries(Chart1.AddSeries(TBarSeries)) do
    begin
      FillSampleValues(12);
      MultiBar:=mbStacked;
      Marks.Hide;
      if i=0 then
      begin
        for j:=0 to Count-1 do
            YValue[j]:=-YValue[j];
      end;
    end;

  SourceSeries:=TPointSeries.Create(Chart1);
  with SourceSeries do
  begin
    FillSampleValues(12);
    Pointer.Show;
    Pointer.Color:=clWhite;
    Pointer.Style:=psCircle;
  end;

  SmoothSeries:=TLineSeries(Chart1.AddSeries(TLineSeries));
  with SmoothSeries do
  begin
    ShowInEditor:=False;
    ShowInLegend:=False;
    SmoothFun:=TSmoothingFunction.Create(Chart1);
    SmoothFun.Interpolate:=True;
    SmoothFun.Factor:=8;
    SetFunction(SmoothFun);

    DataSource:=SourceSeries;
  end;

  Chart1.AddSeries(SourceSeries);
  SmoothSeries.Color:=SourceSeries.Color;
  SourceSeries.Pointer.Pen.Color:=SmoothSeries.Color;
end;