Page 1 of 1
How to do a Portfolio Chart with TChart?
Posted: Fri Apr 17, 2015 10:37 am
by 16569278
Hi,
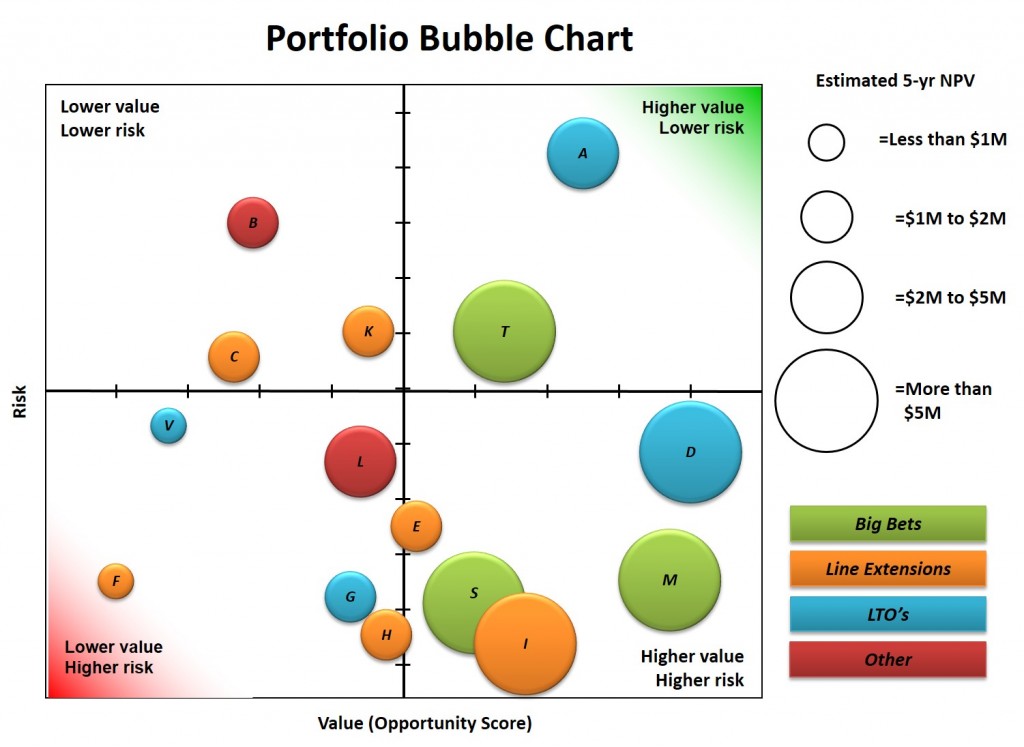
I am trying to do a portfolio chart like
http://ppmexecution.com/wp-content/uplo ... 24x747.jpg with TChart.
I thought the right charttype was Bubblechart, but when I use something like ...
Series1.AddBubble(1,1,0.2,'Portfoliobubble 1');
Series1.AddBubble(-1,-1,0.2,'Portfoliobubble 2');
... both bubbles are shown on top of each other and not - as I would have expected - in the bottom left and top right corners of the portfolio.
How can I achieve a portfoliochart with TChart?
Best regards
Roland
Re: How to do a Portfolio Chart with TChart?
Posted: Fri Apr 17, 2015 11:12 am
by yeray
Hi Roland,
To put the Left and bottom axes in the middle of the chart:
Code: Select all
  Chart1.Axes.Left.PositionPercent:=50;
  Chart1.Axes.Bottom.PositionPercent:=50;
Re: How to do a Portfolio Chart with TChart?
Posted: Fri Apr 17, 2015 1:17 pm
by 16569278
Hi Yeray,
thanks - I know that, but this does not solve my problem.
My problem is that the X value seems to be neglected when I use
Code: Select all
Series1.AddBubble(1,1,0.2,'test1');
Series1.AddBubble(-1,-1,0.2,'test2');
The bubbles are shown in the correct Y value position but in the same X value position.
What do I need to do to have them in different X positions?
Best regards and thanks for your effort
Roland
Re: How to do a Portfolio Chart with TChart?
Posted: Fri Apr 17, 2015 1:54 pm
by yeray
Hi Roland,
Roland wrote:
My problem is that the X value seems to be neglected when I use
Code: Select all
Series1.AddBubble(1,1,0.2,'test1');
Series1.AddBubble(-1,-1,0.2,'test2');
The bubbles are shown in the correct Y value position but in the same X value position.
I've added a chart to a new simple application using TeeChart v2015.14 and the following code:
Code: Select all
uses BubbleCh;

procedure TForm1.FormCreate(Sender: TObject);
begin
  Chart1.View3D:=false;

  with Chart1.AddSeries(TBubbleSeries) as TBubbleSeries do
  begin
    AddBubble(1,1,0.2,'test1');
    AddBubble(-1,-1,0.2,'test2');
  end;

  Chart1.Axes.Bottom.LabelStyle:=talValue;
end;
And this is what I get, that seems to be correct to me:
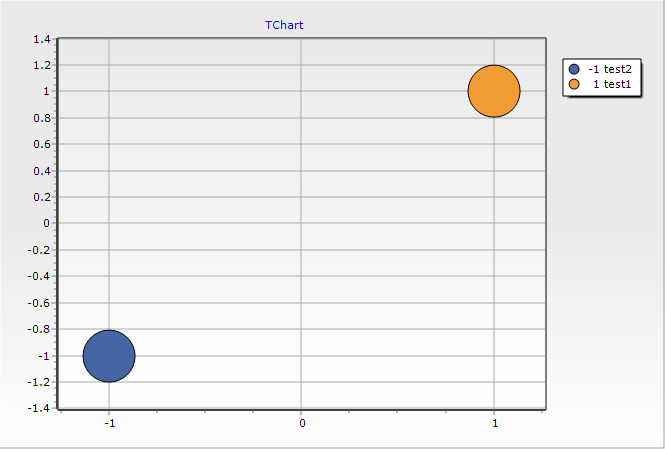
- 2015-04-17_1548.png (14.56 KiB) Viewed 15855 times
If this is not what you are getting please tell us what environment are you using (what exact TeeChart, IDE version and OS) and please arrange a simple example project we can run as-is to reproduce the problem here.
Thanks in advance.
Re: How to do a Portfolio Chart with TChart?
Posted: Fri Apr 17, 2015 2:06 pm
by 16569278
Hi.
That works in the same way for me, but the problem is that I do not want digit values but simply good, neutral, bad labels on the axis and that on all sides of the chart ... (see attachment)
I had problems to get that.
Ok - I achieved what I wanted now, but I do not understand why I need to do it like that - imo it should be easier - perhabs it is and I simply use TChart not in a good way. But I guess a certain complexity cannot be prevented when a component is such mighty as TChart ...
I do it now as follows ...
I added four custom axises to the chart.
In the chart setup I do ...
Code: Select all
Chart.Axes.Left.Automatic := false;
Chart.Axes.Right.Automatic := false;
Chart.Axes.Bottom.Automatic := false;
Chart.Axes.Top.Automatic := false;
Chart.Axes.Left.Visible := false;
Chart.Axes.Right.Visible := false;
Chart.Axes.Bottom.Visible := false;
Chart.Axes.Top.Visible := false;
Series1.AddBubble(1,1,0.2,'test1');
Series1.AddBubble(-1,-1,0.2,'test2');
SetAxisLabelsGoodNeutralBad(0);
SetAxisLabelsGoodNeutralBad(1);
SetAxisLabelsGoodNeutralBad(2);
SetAxisLabelsGoodNeutralBad(3);
SetAxisLabelGoodNeutralBad contains ...
Code: Select all
  Chart.CustomAxes[AAxisId].Automatic := false;
  Chart.CustomAxes[AAxisId].Items.Clear;
  Chart.CustomAxes[AAxisId].Items.Add(1,'gut');
  Chart.CustomAxes[AAxisId].Items.Add(0,'neutral');
  Chart.CustomAxes[AAxisId].Items.Add(-1,'schlecht');
Please let me know if there is an easier way.
Thanks a lot again for your help.
Re: How to do a Portfolio Chart with TChart?
Posted: Mon Apr 20, 2015 8:18 am
by yeray
Hello,
You should be able to do the same using the default Left/Right/Top/Bottom axes instead of using Custom Axes:
Code: Select all
var Series1: TBubbleSeries;

procedure TForm1.FormCreate(Sender: TObject);
begin
  Chart.View3D:=false;
  Series1:=Chart.AddSeries(TBubbleSeries) as TBubbleSeries;
  Series1.VertAxis:=aBothVertAxis;
  Series1.HorizAxis:=aBothHorizAxis;

  Series1.AddBubble(1,1,0.2,'test1');
  Series1.AddBubble(-1,-1,0.2,'test2');
  SetAxisLabelsGoodNeutralBad(Chart.Axes.Left);
  SetAxisLabelsGoodNeutralBad(Chart.Axes.Right);
  SetAxisLabelsGoodNeutralBad(Chart.Axes.Top);
  SetAxisLabelsGoodNeutralBad(Chart.Axes.Bottom);
end;

procedure TForm1.SetAxisLabelsGoodNeutralBad(AAxis: TChartAxis);
begin
  AAxis.Grid.Visible:=false;
  AAxis.Items.Clear;
  AAxis.Items.Add(1,'gut');
  AAxis.Items.Add(0,'neutral');
  AAxis.Items.Add(-1,'schlecht');
end;
I've seen InflateMargins doesn't work fine for the Top axis in the TBubbleSeries when HorizAxis=aBothHorizAxis, so I've added it to the public tracker (
B1197), and I already fixed it for the next maintenance release.
Re: How to do a Portfolio Chart with TChart?
Posted: Mon Apr 20, 2015 10:09 am
by 16569278
Super Support.
I will give your code a try. Thanks a lot.
Best regards
Roland
Re: How to do a Portfolio Chart with TChart?
Posted: Wed Apr 22, 2015 3:36 pm
by 16569278
Works great.
Thanks.