Axis, grid line

TeeChart for ActiveX, COM and ASP
Post Reply
Angelo
Newbie
Newbie
Posts: 14
Joined: Wed Mar 04, 2009 12:00 am

Axis, grid line

Post by Angelo » Mon Oct 20, 2014 11:18 am

Hy guys.

I am trying to have a chart where the grid lines are fixed, but even using increment property teechart does decide where to put the grid lines and sometimes the first gridline at the bottom does not coincides with the Min value I set and this gives less the 6 labels at the axis.

What I want is to replicate the behavior as shown in the image attached.
Left axis divided in 5 parts, and always displaying 6 labels, with some offset in order to avoid data point near the axis.
Snap 2014-10-20 at 09.07.08.png
Snap 2014-10-20 at 09.07.08.png (35.84 KiB) Viewed 22143 times

Yeray
Site Admin
Site Admin
Posts: 9533
Joined: Tue Dec 05, 2006 12:00 am
Location: Girona, Catalonia
Contact:

Re: Axis, grid line

Post by Yeray » Mon Oct 20, 2014 2:54 pm

Hi Angelo,

You could use the axis MinimumOffset/MaximumOffset properties to set the space between the series Minimum/Maximum values and the Minimum/Maximum to be calculated for the axis range.
Then, you could use the axis range or the difference between the Series Maximum&Minimum values to calculate the Axis Increment.
Her it is a simple example that seems to work as expected for me here:

Code: Select all

  TChart1.Aspect.View3D = False
  TChart1.Legend.Visible = False
  
  TChart1.AddSeries scPoint
  TChart1.Series(0).FillSampleValues 1000
  TChart1.Series(0).asPoint.Pointer.HorizontalSize = 2
  TChart1.Series(0).asPoint.Pointer.VerticalSize = 2
  TChart1.Series(0).asPoint.Pointer.Style = psCircle
  
  TChart1.Axis.Bottom.MinimumOffset = 10
  TChart1.Axis.Bottom.MaximumOffset = 10
  TChart1.Axis.Left.MinimumOffset = 10
  TChart1.Axis.Left.MaximumOffset = 10
  
  TChart1.Axis.Bottom.Increment = (TChart1.Series(0).XValues.Maximum - TChart1.Series(0).XValues.Minimum) / 6
  TChart1.Axis.Left.Increment = (TChart1.Series(0).YValues.Maximum - TChart1.Series(0).YValues.Minimum) / 5
If you still find problems with it, please try to arrange a simple example project we can run as-is to reproduce the problem here.
Thanks in advance.
Best Regards,
ImageYeray Alonso
Development & Support
Steema Software
Av. Montilivi 33, 17003 Girona, Catalonia (SP)
Image Image Image Image Image Image Please read our Bug Fixing Policy

Angelo
Newbie
Newbie
Posts: 8
Joined: Mon Oct 20, 2014 12:00 am

Re: Axis, grid line

Post by Angelo » Mon Oct 20, 2014 10:21 pm

hi, even your code is not working as expected.
Sometimes it gives the correct results, but sometimes it does not. Try to press a few times the " steema code" button for the small project I am attaching(1 kb), you will see that teechart sometimes adjusts/displaces the grid lines, maybe due to the offset.

The projetc attached also has my attempt code to have always fixed gridlines, starting at Ymin value up to the Ymax values at dy increments,considering the offsets too.
Attachments
test.zip
(2.39 KiB) Downloaded 1164 times

Yeray
Site Admin
Site Admin
Posts: 9533
Joined: Tue Dec 05, 2006 12:00 am
Location: Girona, Catalonia
Contact:

Re: Axis, grid line

Post by Yeray » Tue Oct 21, 2014 2:19 pm

Hello,

I see you are using TeeChart v8. Could you please check what exact build?
I'm using v8.0.1.1. You can check it in the release note in the installation folder, or showing the TChart1.Version string. Ie:

Code: Select all

Private Sub Form_Load()
  Randomize
  Me.TChart1.Axis.Left.Automatic = False
  Caption = TChart1.Version
End Sub
If I click "Generate x, y" button, then I can click "steema code" button many times, always getting a good looking chart.
However, I've modified the code in your Command3_Click a little bit because you don't need to create a new Point series if there's already one created, and because you are setting the left axis to be "automatic=false" at Form_Load so it wasn't calculating correct minimum and maximum if you never click "Generate x, y" button, where it set "automatic=true".
So with the code below, the charts produced with your application look always as in the image below, just clicking the "steema code" button again and again.

Code: Select all

Private Sub Command3_Click()
 TChart1.Aspect.View3D = False
  TChart1.Legend.Visible = False
  
  If TChart1.SeriesCount = 0 Then
    TChart1.AddSeries scPoint
  End If
  
  TChart1.Series(0).FillSampleValues 1000
  TChart1.Series(0).asPoint.Pointer.HorizontalSize = 2
  TChart1.Series(0).asPoint.Pointer.VerticalSize = 2
  TChart1.Series(0).asPoint.Pointer.Style = psCircle
  
  TChart1.Axis.Left.Automatic = True
  TChart1.Axis.Bottom.MinimumOffset = 10
  TChart1.Axis.Bottom.MaximumOffset = 10
  TChart1.Axis.Left.MinimumOffset = 10
  TChart1.Axis.Left.MaximumOffset = 10
  
  TChart1.Axis.Bottom.Increment = (TChart1.Series(0).XValues.Maximum - TChart1.Series(0).XValues.Minimum) / 6
  TChart1.Axis.Left.Increment = (TChart1.Series(0).YValues.Maximum - TChart1.Series(0).YValues.Minimum) / 5
End Sub
test.png
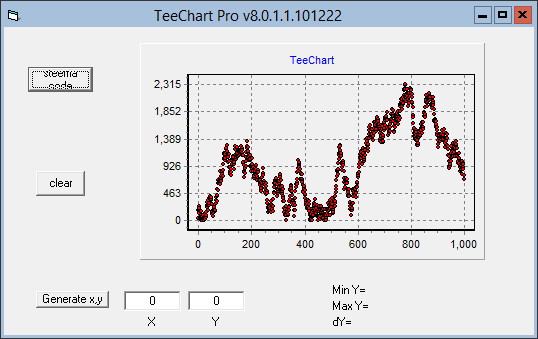
test.png (8.14 KiB) Viewed 22048 times
Best Regards,
ImageYeray Alonso
Development & Support
Steema Software
Av. Montilivi 33, 17003 Girona, Catalonia (SP)
Image Image Image Image Image Image Please read our Bug Fixing Policy

Angelo
Newbie
Newbie
Posts: 14
Joined: Wed Mar 04, 2009 12:00 am

Re: Axis, grid line

Post by Angelo » Tue Oct 21, 2014 2:26 pm

I have been working on it and my code now calculates the final value for the Ymax and Ymin considering the offset, but the problem persists, because teechart chooses by itself where to put the gridlines despite I use SetMinMax and Increment properties , I dont have or I dont know how to control this behavior. An example is the new image below. I attached the new code too.
snap today2.png
snap today2.png (142.88 KiB) Viewed 22043 times
Sorry for the large image !


See the values calculated with the offset and the increment calculated ?

I have set the MinMax property to the values and the increment to the ndy, considering an offset of 25 pixels. Now look at the chart. Where is the first grid line(from the bottom) ? It is at the Y=0 and not at the y=-2.9845, if it was at -2.9845, with the calculated increment I would have 5 labels at the axis instead of 4 as showed.
Attachments
ntest.zip
(45.67 KiB) Downloaded 1130 times
Last edited by Angelo on Tue Oct 21, 2014 2:41 pm, edited 4 times in total.

Angelo
Newbie
Newbie
Posts: 14
Joined: Wed Mar 04, 2009 12:00 am

Re: Axis, grid line

Post by Angelo » Tue Oct 21, 2014 2:30 pm

The same occurred in your chart. The first grid line was chosen by teechart to no start at bottom axis, but at the 0 in your chart.

Angelo
Newbie
Newbie
Posts: 14
Joined: Wed Mar 04, 2009 12:00 am

Re: Axis, grid line

Post by Angelo » Tue Oct 21, 2014 2:34 pm

Hi, mine is V8.0.0.6, although I purchased the last 2014 version yesterday because Teechart is simply fantastic !!.

Angelo
Newbie
Newbie
Posts: 14
Joined: Wed Mar 04, 2009 12:00 am

Re: Axis, grid line

Post by Angelo » Tue Oct 21, 2014 4:27 pm

SUCCESS !!! Got it !!! uhuuuu;


just added

tchart1.axis.left.labels.roundfirstlabel=false !!!

Yeray
Site Admin
Site Admin
Posts: 9533
Joined: Tue Dec 05, 2006 12:00 am
Location: Girona, Catalonia
Contact:

Re: Axis, grid line

Post by Yeray » Wed Oct 22, 2014 7:08 am

Hello Angelo,
Angelo wrote:Hi, mine is V8.0.0.6, although I purchased the last 2014 version yesterday because Teechart is simply fantastic !!.
Thank you! It's nice to hear about happy customers!
Angelo wrote:SUCCESS !!! Got it !!! uhuuuu;

just added

tchart1.axis.left.labels.roundfirstlabel=false !!!
Great! I'm glad to hear you found how to make it work as you want.

Don't hesitate to let us know if you still find any problem with it!
Best Regards,
ImageYeray Alonso
Development & Support
Steema Software
Av. Montilivi 33, 17003 Girona, Catalonia (SP)
Image Image Image Image Image Image Please read our Bug Fixing Policy

Post Reply